


In this article I’ll show you how easy it is sometimes to trade using the fundamental analysis, but only if it is properly combined with technical analysis. I got the idea of this trading style from very well-known forum BinaryOptionsEdge. Before reading this article and this strategy, it would be good to know at least the basics of fundamental analysis, especially this: 4th episode of fundamental analysis – 4 steps to trade news releases.
The principle of trading business announcements strategy
The principle of this strategy is absolutely simple. What you are going to need is today’s economic calendar from forexfactory, Meta Trader 4 and an easy to use and very well-known indicator Bollinger Bands.
How to do it?
1. We look for a macroeconomical announcement
- To search the trade opportunities, we need an announcement that will surely move the price (so preferably marked red). For this trading situation model, I chose the announcement displayed on the picture below. The good thing was, that there were three announcements at the same time – I was sure that the price will move.
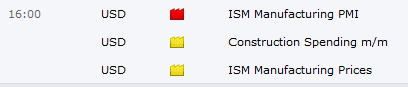
3 announcements at one time
2. Configure a graph in MT4
- It is always necessary to choose the currency pair that includes currency, which takes place in the announcement. Then you should trade this currency pair. For our example it is USD, so EUR/USD or USD/JPY will serve us perfectly.
- We then insert into the graph 2x indicator Bollinger Bands with values 16-0-3.75 and 16-0-3 (period-offset-deviation). You can see how the graph should look like on the picture below. In this case, I used M15 or M30 timeframe.
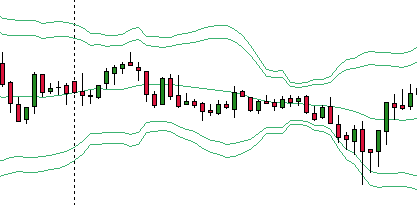
This is the example of our graph
3. Let’s see how the price moves
- Now we have to wait till the announcement (the time of the announcement is always written in the calendar on forexfactory). We are not interested in the result of the announcement or whether the expectations were accurate, too low or too high. What matters is, whether the price moves, because it almost always makes a comeback after a while.
- After the announcement, the candle usually closes between two Bollinger Bands, which we added to the graph, either the lower or the top ones. Once this happens or when the price touches the outside curve, we open our trade in the directions back to the center and for the double of our timeframe. (For M15 it is 30 minutes and for M30 it is 1 hour)
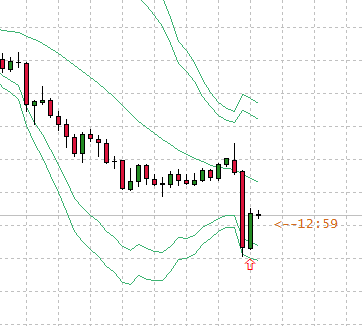
A screenshot from MT4 – A beautiful price turnover
Additional comments on trading
- Not every announcement moves the price in between the Bollinger Bands. Therefore not every announcement means we are opening a trade.
- Do you have any question about this strategy? Leave me a comment below and I will answer you.
- Did you make a profit using this strategy? Leave me a comment below!
- So far my success on this strategy is 100%. I’ve only used it a few times however.
- In one of the next episodes of fundamental analysis, you will find my live trades using this strategy!
More information about fundamental analysis
- Part 9: Fundamental Analysis – How to Analyze Shares Using Data (Value Screening)
- Technical or fundamental analysis: Which one should you choose?
- Part 8: Fundamental Analysis – The “January Effect” – An opportunity or a myth?
- Part 7: Fundamental Analysis – Trading Cryptocurrencies
- How to trade Twitter shares: hundreds of millions in 140 characters
- Facebook is not to share or to like, it is to buy
- Coca-Cola: a second black gold?
- Bitcoin? What is it? Why such a sky-rocketing rise? Can one make money on bitcoin?
- Make money on the longest decline of Apple shares since July 2016!
- Make money within 10 minutes thanks Tesla and its electric future!
Author

More about the author Step
I've wanted to build a business of some kind and earn money since I was in middle school. I wasn't very successful though until my senior year in highschool, when I finally started to think about doing online business. Nowadays I profitably trade binary options full-time and thus gladly share my experiences with you. More posts by this author
Hi
I am new in trading and I am interested in knowing this strategy deeper
Would you please re-explain this strategy bit by bit using graphs and bollinger bands like you did I need to get this very well.
Thanks
Dear VICTOR, I recommend you to read some articles from our series of articles about technical analysis.