Hello, everyone!
I present to you a new series of binary options trading articles. It will be loosely related to the MT4 show, so if you do not know that show, be sure to check it out, it is essential to understanding of everything we will learn in this show.
In this show, we can look forward to explanation of various strategies, which will be little more complicated and not as easy, as watching simple indicators. 🙂
In the first part we will talk about one of the most basic things – trend lines.
What are trends?
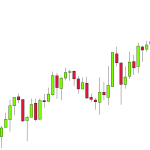
There are two trends – increasing (uptrend) and decreasing(downtrend). Increasing trend means, that the price for the previous period (of eg. 40 candles) is increasing rapidly and if it (the price) falls, then its only slightly and it will begin to increase (uptrend) very soon. Decreasing trend is complete opposite – the price is rapidly decreasing.
Trends tell us, whether the long-term price rises or drops. Sometimes it also happens that the price does not have any trend = it is stagnating. This means that the price in the last period somewhat increased, but on the other hand also decreased. The price isnt higher or lower by much. Are we clear? 🙂
How to use such a trend to our advantage and proper assumption of further development is a question little more complicated. We have a choice of two options: Either the price will continue this trend or it will reach certain threshold and make so-called turnover and begin to develop in opposite direction.
Drawing trend lines
Drawing trend lines is one of the strongest indicators there is. It will help us predict the reversal of the trend, when (if) the price reaches certain limits. Lets learn together how to draw such lines.
Drawing trend lines for the growing trend
- We will determine, whether the trend is actually increasing (according to the aforementioned definition. )
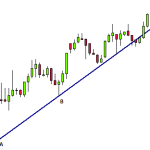
- In the chart we find a place that has recently been lowest. (A)
- We connect this place with the closest point drop in the graph. (B)
- We extend the line.
What is the line useful for?
We see that every time after the price touched our line, it bounced back up. Using this line, we can predict that if the price touches our line, then it will probably increase, so we can choose the CALL trade with our broker.
Drawing trend lines for the downtrend
Drawing trend line for the downtrend works on the same principles, the only difference is that everything is done the opposite.
- We determine whether the trend is indeed decreasing (according to the aforementioned definition. )
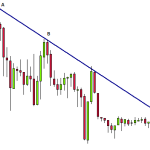
- In the chart we find a place that has recently been highest.
- We connect this place with the closest point of maximum rise in the prices during a downturn.
- We extend the line.
And why did we do this again?
We see that every time after the price touched our line, it bounced back and started to decrease again. Using this line, we can predict that if the price touches the line, it should decrease and therefore we can choose the PUT trade with our broker.
That would be all for today. I hope that i have taught you something new, and in the next episode we will talk about the inner and outer trend lises which are equally important.
If you liked the article, or if you have any comments, i will be very happy if you let me know in the comment section.


can i find the same tools on Olymptrade platform to draw this lines
Tetteh, unfortunately that’s not possible. I recommend to download the program Meta Trader 4 where you can make all the analysis.
That’s nice of you. But with what will I draw the line?
Dear Dave, if you’re using MT4, there’s plenty of tools to do so.
Thank you
this is really good
Very helpful. Thank you for giving yourself time to write this