


In this article, we will take a look at how to use the data you can find in the Finviz platform, specifically, how to use it in real trading or when selecting shares using value screening.
Finviz as a wellspring of knowledge
Finviz acts as a bus for many sources. It combines data from the Stock Exchange, Bloomberg, the Wall Street Journal Marketwatch, CNBC and other sources. When it all comes together, with every title you can see not only the base in the form of a graph but also the information about the given company and the latest news.
To overcome the competition, Finviz offers basic technical analysis in addition to the fundamentals. Everything is in one place, and moreover, free. But how to know your way through all this information and how to recognize what is worth monitoring?
What stocks to monitor?
If you want to start completely blindly, there are two ways you can do so. The first is a detailed analysis, the second is a filter using Finviz maps. On the “map”, you can choose from options like1 Year Performance or Year To Date Performance. You can immediately see which stocks are rising or falling in the swing scale (weekly/monthly).
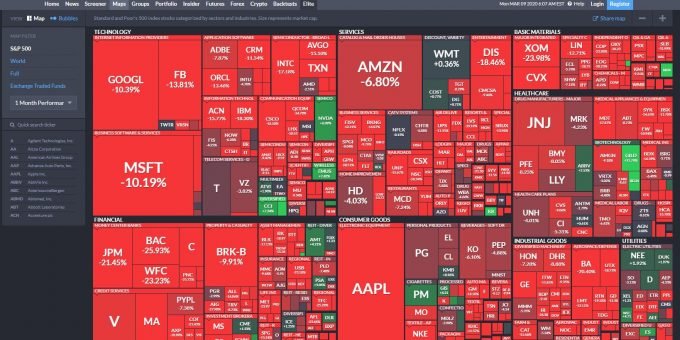
Finviz Performance Map
Personally, I would use this filter for a better overview of the market. It can also be said that this allows us to monitor the development of the economic situation. Finviz merges all shares into sectors, so it is immediately clear how technology, finance, healthcare, and other industries are doing.
Based on this analysis, we can choose long-term increasing or decreasing shares and focus on them in individual analysis.
Technical analysis could also help. The second option is to use a general filter.
Using Finviz filters
Finviz offers an incredible amount of filters. We cannot go through all of them in this article, however, we can and shall talk about the most famous and most important ones. So, let’s explain the indicators, talk about their ideal value, and take a look at how to choose the right shares to buy.
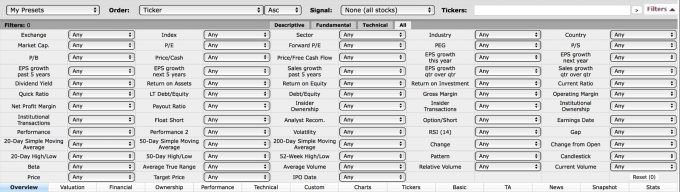
Finviz Filters
Price-to-Earnings ratio (P/E)
The Price-to-Earnings ratio, abbreviated as P/E or PE, or the ratio between the market price of a share and the net profit per share, is a fundamental indicator. It is similar to the moving average in technical analysis. P/E tells us how much the investor is willing to pay for the company’s profits.
If the price of a share is $ 60 and the company’s earnings per share are $ 3, then the P/E will be at 20 (60 divided by 3). In this case, the investors are obviously willing to pay $ 20 for every single dollar of the company’s profits.
The classic P/E indicator measures the current share price with a profit for the last 12 months. There is also the forward P/E indicator, which measures the current price with the expected profit in the following year.
What is the ideal P/E ratio?
In other words, the P/E ratio tells us how many times the market share price is higher than the earnings per share. Logically, we want the highest profit for the least money possible. But that can be risky.
Tobias Levkovich of Citigroup tested the empirical dependence of P/E and stock price developments in the S&P 500 index. This analysis found that with only a few exceptions, the best ratio was between 14-16.
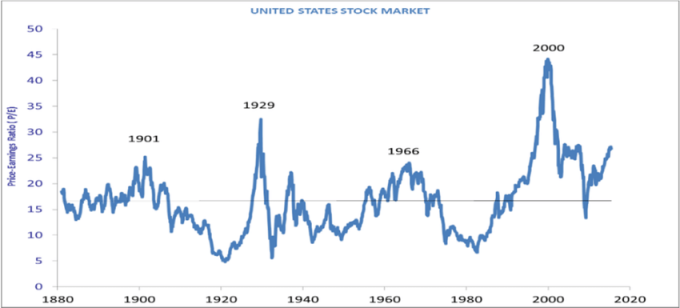
Average historical P/E on the US stock market
P/E offers quick information, but we do not recommend trading purely on its basis. Last year’s profits may no longer reflect reality and forward P/E works with estimates. P/E ratio is good but has limited possibilities and should be supplemented with additional data.
Market Capitalization (Market Cap.)
Market Capitalization is another parameter you should not miss. Higher growth potential is best found in smaller companies, while stability is best found in larger ones.
What is the probability that Apple shares will multiply its value in the next 2 years? Close to zero. However, with smaller companies,it’s in the realm of possibilities.
In terms of calculation, market capitalization is equivalent to the price of one share multiplied by the total number of shares.
The company is considered a big company on the US Stock Market if its market capitalization crosses over $ 10 billion. The medium-sized company is between $ 2-10 billion, while those under $ 2 billion considered small companies.
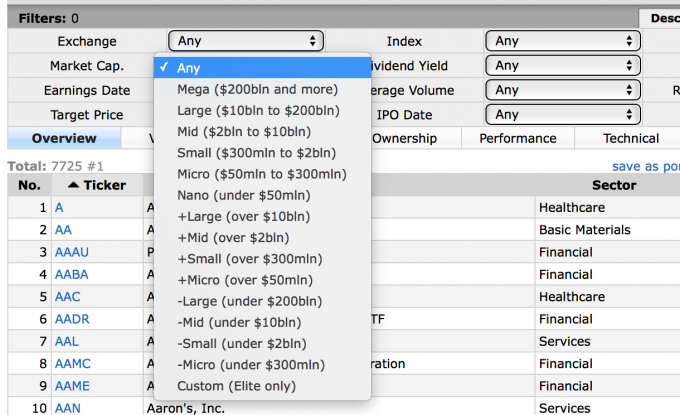
Market Capitalization on Finviz
Because $ 2 billion is still quite a lot, we can also find a micro-label, which is for companies under $ 300 million and a nano label for companies with a market capitalization of $ 50 million. It is in these orders you should look for penny stocks.
If you have seen the legendary movie Wolf from Wallstreet, you know what that is.
The choice of market capitalization is entirely up to you, but if I were looking for something with high potential, I would stick with small companies.
Income (Operating Revenue)
Every company owner is interested in revenues and then profits. The English word income usually means operating revenue. It is not a self-explaining value, as its information importance lies in comparison.
Costs/income ratio shows us the ratio of operating costs to revenues, i.e. how efficient a company is, or at what cost it generates revenues. If it achieves high, low-cost sales, it is likely to be more efficient than its competition, and probably has competitive advantages and therefore offers itself as a good investment.
The cost/income ratio is suitable for comparison with other companies. They vary according to market, segment and overall economic situation. For example, in times of crisis, this indicator usually increases because there is a higher demand on low costs, as seen in the 2008 crisis compared to the year 2007.
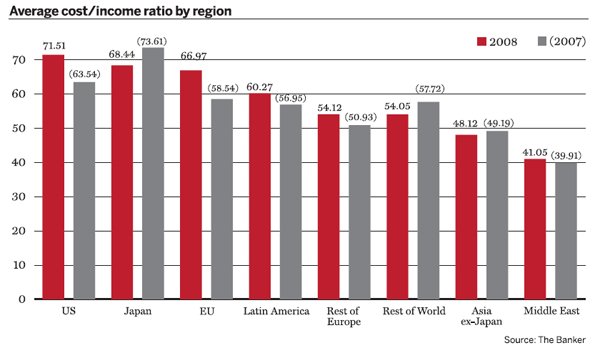
The operating cost/income ratio in the time of the 2008 crisis and before the crisis
Earnings Per Share (EPS)
The EPS (Earnings Per Share) indicator can also be used as a supplement to the P/E. EPS shows a profit after tax and dividend preference per share. In other words, the amount of profit per ordinary share that could be paid out in the form of dividends if the company did not consider reinvesting.
However, we intentionally place the EPS indicator below income rather than below the paragraph with P/E.
Why? Again, it is possible to relate EPS to income. Neither of the indicators says much alone, but rather in comparison. However, the comparison with other companies or additional data is always necessary.
Dividends
Is it worthwhile to monitor whether and in what amounts the company pays dividends?
Yes and no.
It depends on stock selection, investment duration, and many other parameters. There are growth stocks, dividend stocks and so on. In general, however, dividends can reduce the risk of investment and are worth monitoring.
If I know that certain stocks have been stable for a long time and pay a high dividend, then it appears as a good investment only on the basis of these parameters.
In general, you can look for stocks that offer an annual payout ratio of 3 or 4 percent and above. This is the amount that includes inflation and reduces the overall risk of investment.
Average Volume (Transaction Volume)
This last indicator is the average volume of shares traded per day. You will make use of this indicator when analyzing smaller companies and especially if your capital is above average.
Sufficient supply and demand mean faster execution of your trading orders and lower total costs (so-called slippage). Personally, I would stick to a value of at least $ 300,000 per day.
Finviz and indicators
Now we put the abovementioned parameters into the finviz.com filter and add a technical analysis element. For example, a simple purchase condition – a price above the moving average with 50 days period. The result can be found here (as of August 23, 2019):
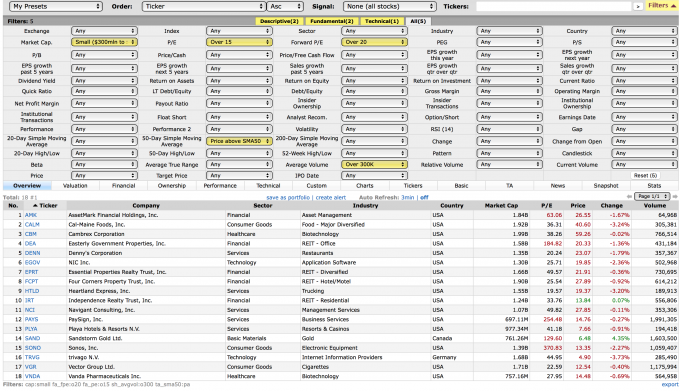
Finviz Filter Result
Subsequently, it is necessary to click open each company and do at least a basic technical analysis. As you can see, everything is perfectly connected, so you just need to understand the basic fundamentals, know the basics of technical analysis, and to be able to create an advanced analysis.
What are your thoughts on Finviz? Are you an active user? What is your selection of stocks based on? Let us know in the comments!
Other sources of information
Author

More about the author J. Pro
Unlike Stephen (the other author) I have been thinking mainly about online business lately. I wasn't very successfull with dropshipping on Amazon and other ways of making money online, and I'd only earn a few hundreds of dollars in years. But then binary options caught my attention with it's simplicity. Now I'm glad it did because it really is worth it. More posts by this author