


The majority of retail traders rely purely on the technical analysis. No wonder, technical analysis is a relatively simple tool bringing good results. At various websites, you can find plenty of guides helping traders in using this tool. Our website itself contains (in our series on technical analysis) more than 20 articles about chart analyzing.
What are the most popular indicators of technical analyzing and how to use them in trading strategies? Read more.
Moving average (MA)
A simple moving average is clearly defined by its name. It is the average price of a security over a specific period. Each trader may choose a period – the same as the price – from which the moving average should be calculated. Usually, traders choose between the opening and closing prices. However, you can also choose the median, average or high/low.
When trading, next to SMA (simple moving average) you may come across EMA (exponential moving average). It’s similar to SMA except that more weight is given to the latest data. This means that the price of yesterday is more important than the price one week ago. EMA is also known as an exponentially weighted average.
How to make use of moving average?
The first option does not give you a signal to open a trade but it’s equally as important. A long-term MA (with high periodicity) indicates a trend. The trend may also indicate a trend line. Moving average can prove its quality in many situations. Remember: Most of the time markets move sideways. To recognize a trend may not be as easy as it appears to be at first sight.
With moving average, you can quickly predict a trend in the market, downwards or upwards. Obviously, nothing is either white or black, but as a tool for making a basic analysis this indicator id fairly sufficient.
You surely are more curious about trading strategies, aren’t you? Well, the simplest one uses the crossing of moving average and price. The situation may look like this:
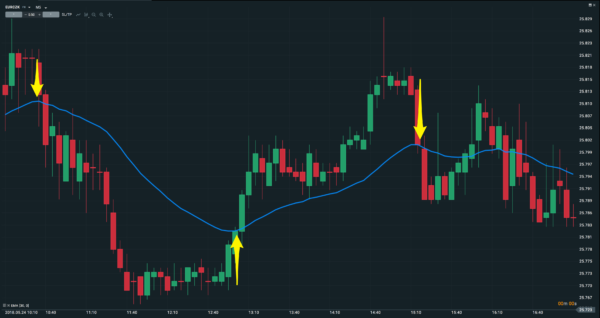
Price crossing the MA line -> signal to buy or sell
Another option is the crossing of moving average, sometimes referred to as Death cross. Most frequent combinations are the following ones: 20-day and 50-day, 20-day and 100-day or, 20-day and 200-day. Moving average with a lower period is always more volatile and as such more quickly reflects the latest prices. The crossing of a long-term moving average top-down indicates a signal to sell, the opposite means a signal to buy.
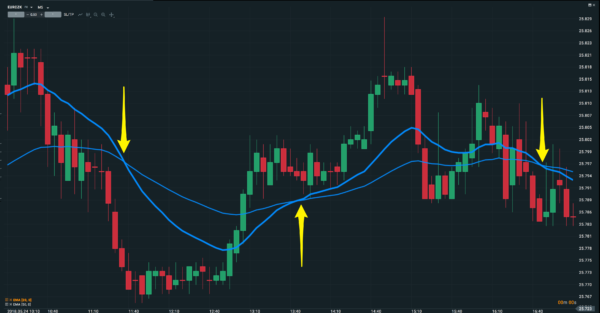
A crossing of MA (moving average) -> signal to buy or sell
Bollinger bands
Another indicator popular among traders, especially the beginners, is Bollinger bands. This tool was invented by John Bollinger in the 1980s. As a technical indicator, Bollinger bands help visualize volatility and relative price levels over a particular period of time. The bigger the volatility, the broader the Bollinger band.
Bollinger bands are mostly based on a 20-day moving average (open to changes) and a standard deviation. The upper and lower bands usually make up the double of a standard deviation. Bollinger points to an area where the market should move and once this area is broken the situation is regarded as non-standard, which might be used as a trading signal (even though Bollinger himself does not specifically recommend this method).
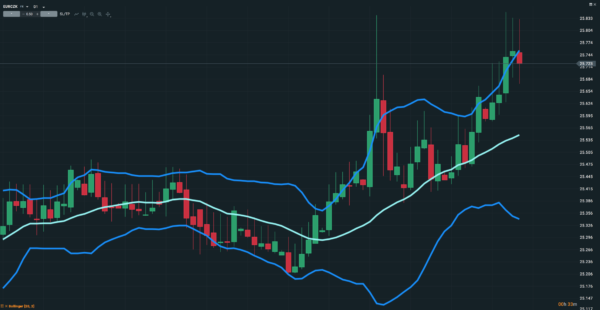
Bollinger bands: the price moved out of the band
What are Bollinger bands good for? If a band is broken this is a warning or confirming signal of a different pattern. Bollinger bands can be combined with other technical analysis tools to help you as the main or confirming signal.
TIP: We recommended the use of Bollinger bands in a simple strategy for trading fundaments. For more details, read here.
Technical analysis as such is a far broader topic. What we never recommend is draw trend lines or use indicators such as RSI or MACD. Be careful not to over-combine the indicators. Use three to four indicators at a time, not more.
Anyway, we will revisit the topic (i.e. basic indicators of technical analysis) in our next articles.
Next Parts of Technical Analysis Show
- Part 35: Technical analysis – What is volatility
- Part 34: Technical Analysis – Head and Shoulders Price Formation
- Part 33: Technical Analysis – How and why use different time frames
- Part 32: Technical Analysis – Why and How to Track Volume
- Part 31: Technical Analysis – Order Book 2
- Part 30: Technical Analysis – How To Recognise False Breakouts w/ Examples
- Part 29: Technical Analysis – Pivot points: Be One Step Ahead!
- Part 28: Technical Analysis – Trade With The Big Players
- Part 27: Technical Analysis – Using Order Book
- Part 26: Technical Analysis – Initial balance
Author

More about the author J. Pro
Unlike Stephen (the other author) I have been thinking mainly about online business lately. I wasn't very successfull with dropshipping on Amazon and other ways of making money online, and I'd only earn a few hundreds of dollars in years. But then binary options caught my attention with it's simplicity. Now I'm glad it did because it really is worth it. More posts by this author