


Every trader has his or her favorite timeframe, in which they spend most of their workday. It is quite common, and it is the same case with me, but it is still necessary to know what the lower and higher time frames look like. You want to know why? Or how to work with timeframes? If so, continue reading and take another look at the markets.
“The trend is your friend”
You’ve certainly heard these words several times. It may already sound like a cliché, but it is still valid. To put it simply, if the market is in a downtrend, in the long run, buying long is, at least statistically speaking, riskier than trend trading, i.e. selling short.
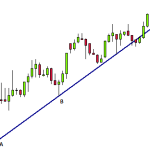
It may sound quite clear, but in practice, this is very often overlooked. Why? The reason is simple. I spend most of my business within a 30-minute timeframe. This very timeframe can provide me with the perfect signal to buy, but the market can be in a long-term downward trend from a daily, weekly or yearly perspective. So, I have a trading signal according to my strategy, but I should nevertheless be cautious because though I am working within a small timeframe (where I want to buy), the market is declining in the long term.
Although this signal from the 30-minute timeframe may be strong, I would be trading against a long-term downward trend, which may not pay off.
Market analysis
Though this depends on you and your business style, you should always be aware of the general overview of the market. Personally, I am starting to analyze the market in long timeframes. Feel free to use weekly or monthly candles. Through this view, you will be able to see the long-term mood on the market.
Determine the direction of the trend, write down important supports and resistances (it is good to describe everything, e.g. “Support from a monthly timeframe”), and it is important to have all time zones view turned on or you will not be able to see this support elsewhere).
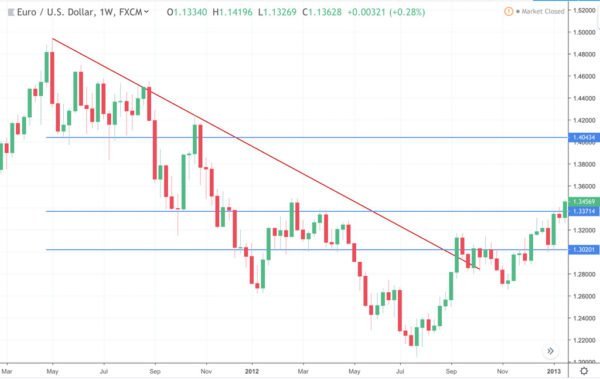
Example of EUR/USD Quick Analysis on a Weekly Chart
You now have important levels, you know the long-term trend, and you can switch to a day view, for example. From there you do the exact same thing. Finally, you can switch to 30M, if you trade in an even lower time zone, for example, 5 minutes, I would add a 4H timeframe to the analysis, but it’s up to you. This trading aspect requires common sense, because analyzing each timeframe is meaningless, as you would be overloaded with data and receive conflicting trading signals.
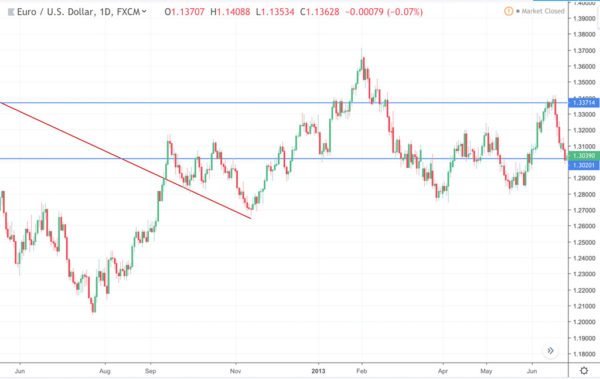
Zoom in on an already analyzed graph. Now on a daily chart.
As you can see in the picture above, the lines drawn from the higher timeframes will serve as a good orientation tool when zoomed at.
Market speed
Sometimes it so happens that the market goes sideways, and nothing really happens within your timeframe. Or, on the other hand, the market can make a significant move, but it is not enough to activate the position within your time frame and the market suddenly cools down (this often happens RIGHT before the closing of the market on Friday night, or before handing over a trading sessions between world centers).
In these cases, it is again appropriate to look at leastwise 1-timeframe below. So, if nothing happens at 30M (30 minutes), I look at 15M or maybe 5M. Of course, I recommend this procedure to be backtested on a demo account, but your trading strategy should work within other timeframes and it is such an interesting opportunity.
Timeframes interweaving
An overview, drawing of important lines from other timeframes (typically longer timeframes) is a great asset for trading. It will offer you a further view of the market and can serve as a good filter. For example, if I evaluate downtrend on a daily basis, I won’t even enter 30M by buying. This is just an example; you can, of course, set it differently and make it tailor-fitted to your trading strategy.
Finally, I would like to add that in some software, for example, Ninja Trader, it is possible to program or download from the internet functions like an interweaving timeframe. Then you can view the moving average from another timeframe. Consider this simple information, nothing else. To begin with, it will be enough to look at other timeframes, take notes, and draw important levels. We will discuss more advanced analysis within the rest of this series.
Let us know in the comments: What timeframes do you use?
Want to know more about Trend lines? Read the articles below:
- Part 1: Technical Analysis – Trend Lines
- Part 3: Technical Analysis – Using Trend Lines
- Part 4: Technical Analysis – Using Trend Lines
Author

More about the author J. Pro
Unlike Stephen (the other author) I have been thinking mainly about online business lately. I wasn't very successfull with dropshipping on Amazon and other ways of making money online, and I'd only earn a few hundreds of dollars in years. But then binary options caught my attention with it's simplicity. Now I'm glad it did because it really is worth it. More posts by this author