


Hello and welcome to another episode of technical analysis. Today I will show you detailed examples of trading binary options with one of the most basic (but still very important) things – trend lines. We have already talked about how to draw the trend line in the first episode of technical analysis, so if you do not know how to, I definitely recommend you to read it.
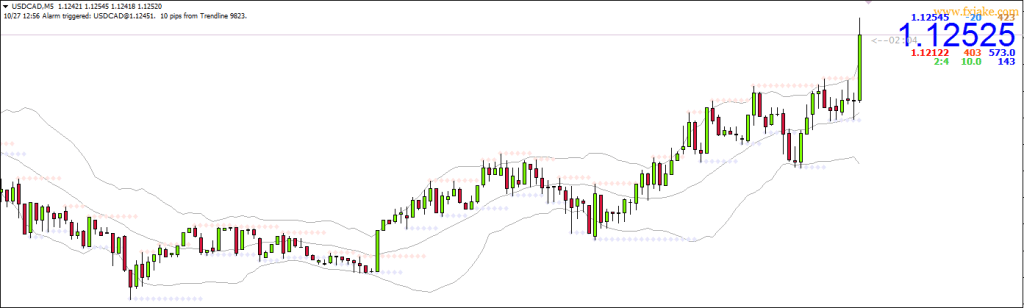
Image 1: Graph USD/CAD with M5 timeframe.
Image 1 is a preview of price development from this morning with the M5 timeframe, which means that one candle represents the development of the price in 5 minutes. Let’s draw the trend line of resistance uptrend. I prefer to draw trend lines in higher timeframes than the one we use to look for trades. So I switched to the M15, drew the trend line and switched back to M5 for better orientation.
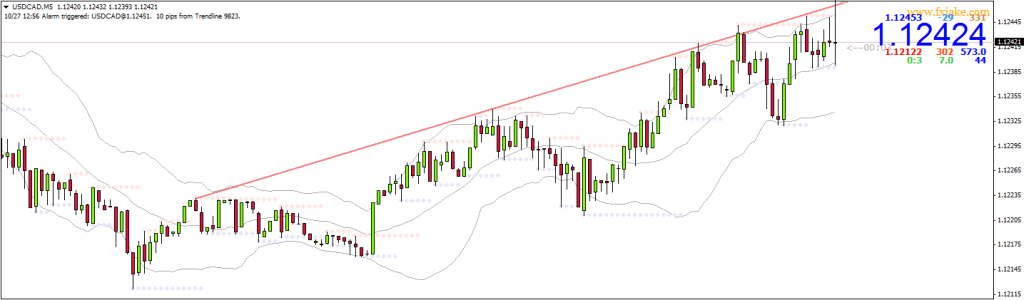
Image 2: Graph USD/CAD with M5 timeframe from this morning with TL.
In Image 2, we have drawn the trend line. We see that every time the price touched our trend line, it bounced back down beautifully and created plenty of opportunities for trades. If we had used only the strategy of trend lines revearsals, we would have had plenty of opportunities to trade.
Let’s look at them in the Image 3
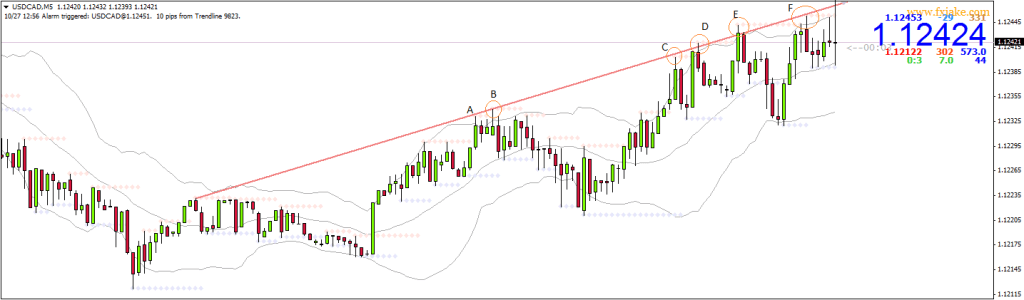
Image 3: Graph USD/CAD with M5 timeframe from this morning with TL and trades
In Image 3, I have marked all the places that we would be interested in. Now let’s talk about why they are important.
- A: At this point, we still could not trade because it is the place we used to draw trend line. Until then, we did not know whether this point was going to be a little higher or lower.
- B: Intersection with TL, while the first point of trade. We entered the trade with a PUT option with the expiration time of 15 minutes. It ended In-Money.
- C: Place of second trade. We entered the trade with a PUT option with expiration time of 15 minutes.
Unfortunately it resulted Out-Of-Money. - D: Place of third trade. We entered the trade with a PUT option with expiration time of 15 minutes.
It ended In-Money. - E: Place of another trade. We entered the trade with a PUT option with expiration time of 15 minutes.
It ended In-Money. - F: Last trade. We entered the trade with a PUT option with expiration time of 15 minutes.
It ended In-Money. - G: No point G has been drawn yet, but we can see it is coming. Candle crossed the TL, and at that moment we could have placed another PUT trade. It seems, we could have ended in-money, but who knows? At the time i wrote this article, I did not know what happened next.
Delightfully, we have shown, that using of a simple strategy, which does not even use any special indicator, can nicely estimate the movement of the market. Suppose we traded with the broker Stockpair and with the lowest possible trade size of $ 20. We had 5 trades, 4 of which ended profitably. Total profit would amount to $ 44. That isn’t bad at all for one afternoon. 🙂
| Broker | Bonus | Min Deposit | Payout | Review | Open Account |
|---|
Author

More about the author Step
I've wanted to build a business of some kind and earn money since I was in middle school. I wasn't very successful though until my senior year in highschool, when I finally started to think about doing online business. Nowadays I profitably trade binary options full-time and thus gladly share my experiences with you. More posts by this author