


 Do you make an analysis each day trying to predict today’s price movements? Would you like to know the estimated size of a price movement and important support and resistance levels?
Good, today I’m going to show you how to do it. It’s all very easy. This topic is called pivot points.
What are pivot points?
You won’t find this topic in literature too often. People assume that you know the meaning and tend not to explain any details. If you want to participate in trading you should at least know what they are talking about and accept the basic logic behind each trading strategy.
In the past, traders realized that each market has a memory. As mentioned, the market is a living organism (no wonder it’s composed of people). The market tends to react to prices occurred recently.
If you want to use pivot points in your trading take the average, close, high and low from the previous day and divide the total by three. This simple calculation will give you the central pivot i.e. a likely level for the next trading day. Based on the calculations of high and low from the previous day you can determine the support and resistance levels.
Calculation of pivot points
Don’t be afraid. The calculation is very simple. As mentioned above, the calculation of the central pivot point (marked P) is done under the following formula: close + high + low : 3.
To calculate the first resistance, use P, multiply by two and deduct yesterday’s low. The calculation of support is a similar process. Deduct yesterday’s high from twice the central pivot point. You can continue by using the support levels and resistance levels for the calculation of higher support and resistance levels (i.e. more distant from the central pivot point).
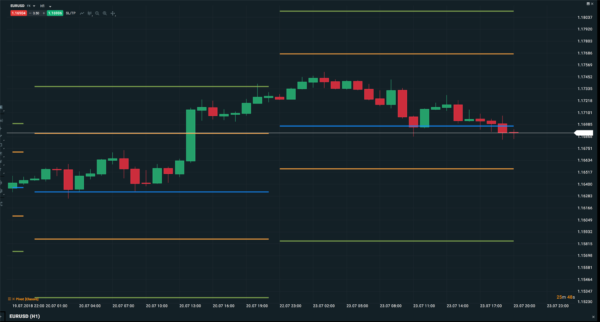
Pivot points put into a graph
Formulas:
- C1 yesterday’s CLOSE
- H1 yesterday’s HIGH
- L1 yesterday’s LOW
- Central pivot point (P) = (H1 + L1 + C1) / 3
- First resistance (R1) = 2×P – L1
- First support (S1) = 2×P – H1
- Second resistance (R2) = P + (R1 – S1)
- Second support (S2) = P – (R1 – S1)
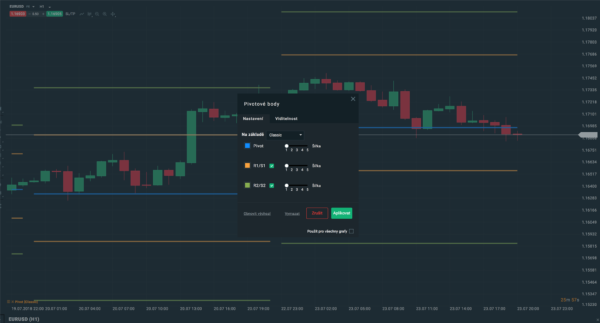
A setting of pivot points
Using pivot points
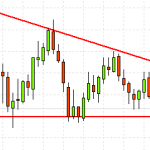
The pivot points trading strategy is similar to initial balance trading. (What is an initial balance?). You have a spread for the day. Once the market reaches the spread, it can either bounce back to the central pivot point or break. The pivot points trading strategy won’t tell you what happens to the support levels and residences but it’s very likely that these will be the levels at which the market reacts. To forecast the future reaction you can use various tools such as ADX or Stochastic.
There are several options to proceed: You can wait for one candlestick for a break or come back and then make a trade. Alternatively, you can look for another confirming pattern. The pivot points trading strategy is a handy indicator but when complemented it is even better. Knowing that the range between the first support and resistance is bigger or smaller than usual can also be useful. If the range is too big we might draw a parallel with a marathon runner who after finishing a marathon race is too exhausted to repeat his excellent performance. Similarly, the market will be exhausted too to break the range. On the contrary, if the market is perfectly recovered and the range is small you may expect a break.
What to do with pivot points
Pivot points are a great tool. I would not construct my trading strategy purely on pivot points but in combination with an indicator or a graphical formation, I would.
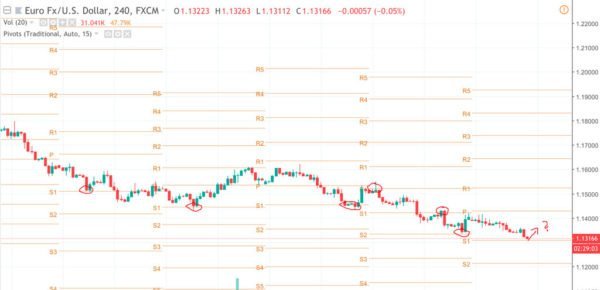
Proof that pivot points work well in practice, not just theoretically.
The benefit is the robustness of the system that can be applied to any instrument available in the market be it forex, commodities or cryptocurrencies. I recommend you dedicate one morning to testing this strategy on historical data of your chosen instrument.
Author

More about the author J. Pro
Unlike Stephen (the other author) I have been thinking mainly about online business lately. I wasn't very successfull with dropshipping on Amazon and other ways of making money online, and I'd only earn a few hundreds of dollars in years. But then binary options caught my attention with it's simplicity. Now I'm glad it did because it really is worth it. More posts by this author