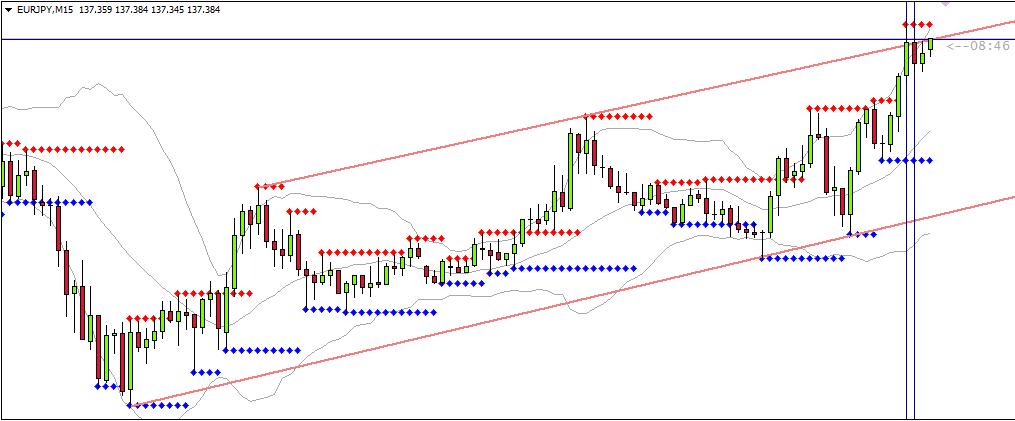
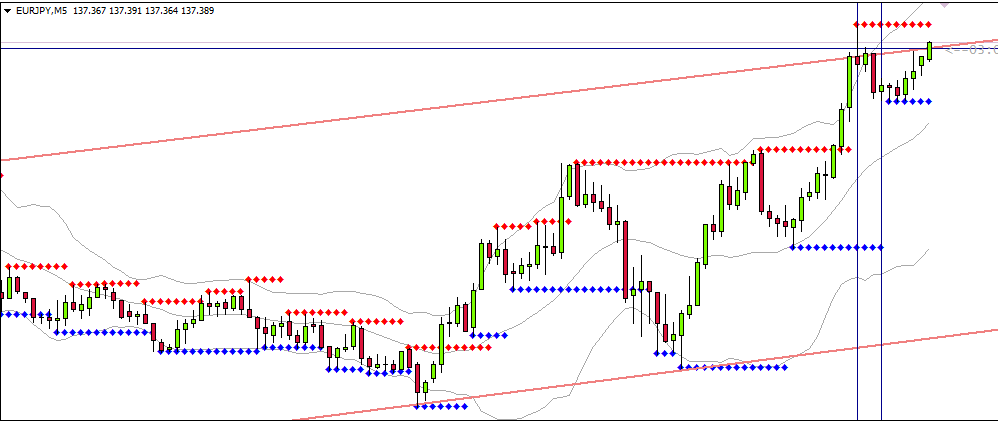
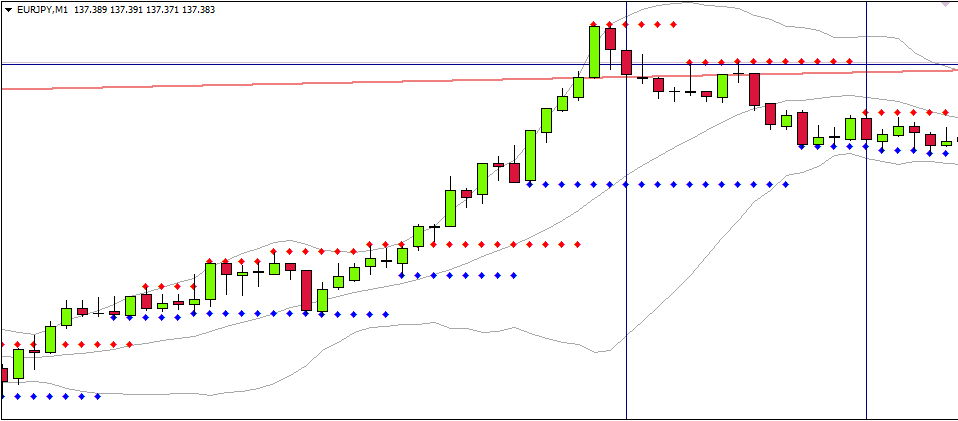
As we said in the third episode of technical analysis, using trend lines in the world of binary options is one of the most fundamental and most reliable methods. This morning I made two lovely trades, let’s analyze them together.
For these trades I used the broker Stockpair, because of it’s expiration time of exactly 15 minutes, which no other reliable broker provides. Unfortunately, this broker doesn’t exist anymore. However, you can use Olymp Trade.
Trading USD/JPY option
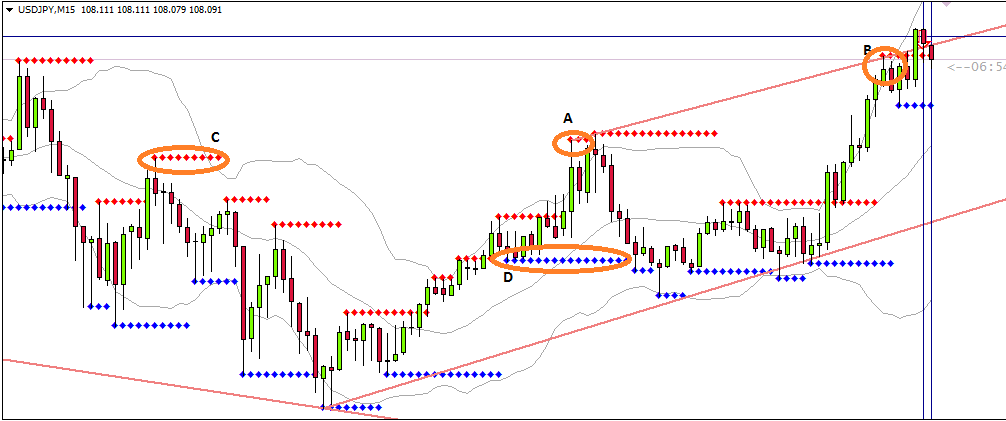
Fig. 1: Drawing trend lines
Probably the first thing I will explain is what indicators I used. The first is, of course, Bollinger bands – gray lines. Then, marked with the letter C and D supports and resistance lines. Pink lines are the trend lines that I had drawn, and the blue vertical lines I used to indicate the open and expiration times.
First I drew the trend lines. I drew them on M15 timeframe, which is one bigger timeframe, than the one where I was looking for trades (M5). From point A, I led (drawn) the ray to point B.
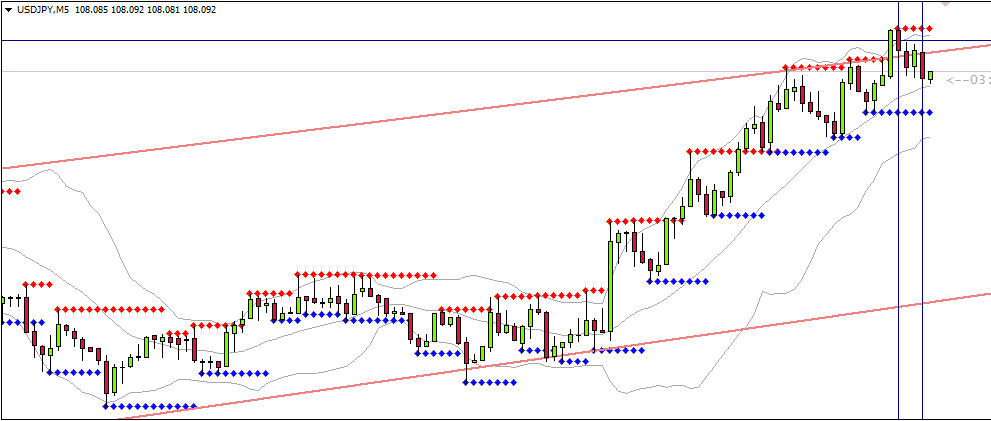
Fig. 2: M5, entering the trade
Fig. 2 is with the timeframe of M5. At the point where you can see the first vertical blue line, I noticed the rise of the price over the TL followed by a correction. Roughly in a half of the bullish candle, I opened a PUT trade for 15 minutes. The investment paid off and $53.4 were in my pocket.
| Broker | Bonus | Min Deposit | Payout | Review | Open Account |
|---|
Trading EUR/JPY option
I think, that the next trade does not need any comments. 🙂


