In this article I will try to introduce some indicators for Meta Trader 4, which I think are very important for binary options trading. It is true that the base chart itself tells us more than indicators, but on the other hand they are also needed and help us not only with finding the best time to open a trade, but also make our charts easier to read and work with.
4 Indicators for binary options trade that EVERYONE should use
Okay, maybe i overdid it. There is no need to immediately and mindlessly download and use all these indicators, but I personally cannot imagine working without them anymore. I use them on every graph of mine irrespective of whether I trade using trend lines, Fibonacci lines or simply going with the trend.
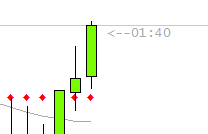
P4L CandleTime

Preview of indicator
This simple, easy to understand and useful indicator adds a little arrow next to the current candle and shows us how much time is left until the end of the candle, which is always convinient, especially if you trade with TopOption. Because TopOption does not offer options expiring after certain time, but expiring at exactly specified time. Instead of a 15-minute expiration you can also have 20-minute or 7-minute expiration.
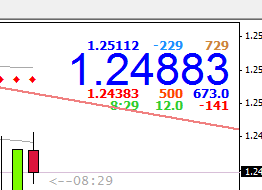
Download indicatorTS_Market Price
This is another indicator, which rather than helping with the trades themselves makes the work and orientation in the graph easier. Its main and only purpose is – to display the current price of selected asset and it does this with pretty big and visible lettering, not the tiny letters used on the right side of the Meta Trader window. Do not expect anything else than ease and clarity from this indicator.
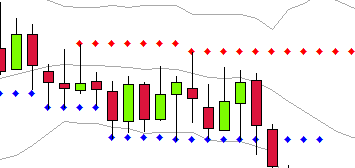
Download indicatorSupport and Resistance (Barry)
Finally we come to the indicators that will help us with technical analysis. There are plenty of indicators that can show us support and resistance and I am not saying this one is the best. Of course, everyone has different preferences and therefore I recommend trying several indicators and decide for yourself. I personally use this one.
Download indicatorBollinger Bands
This is one of the most basic indicators used for technical analysis since the 80s. It shows us the market volatility and the asset prices usually move within the limits of these zones and bounce from one side to the other.
This indicator is installed in MT4 from the beginning, but I do recommend you to use it.
How to install indicators?
- Open already installed Meta Trader 4.
- In the upper left corner, select “Open Folder Data.”
- Open the folder MQL4 and indicators.
- Extract downloaded indicator into this folder.
- Exit MT4 and turn it on again.
- In the top menu, select Insert -> Indicators-> Custom (or Trend for the Bollinger Bands)


