Ever since I started publishing articles discussing trend lines(Using trend line, Trend lines, Examples of using Trend lines), I’ve started to receive a lot of questions, such as how to draw a TL or can we draw directly into MT4? This inspired me, so I’ve decided to write another piece for Meta Trader 4 show. This time, we’ll be talking about working with graphics in MT4 – how to draw, erase or edit your own templates.
How to edit charts for a comfortable binary options trade
The first and the most important thing is to have a chart that you can make sense of. If you download a template from somewhere on the internet, it may not be a bad move, but still, don’t be afraid to edit it in the way that suits your needs.
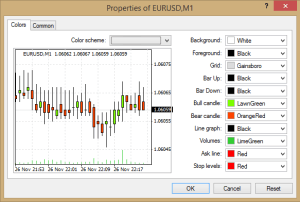
Right-click in the area of the chart(not on any indicator) and select Properties, after which a window will pop up (Image 1)
We can a see a preview on the left of how the chart is going to look like, after confirming the changes.
On the right, you can see options that can be changed. Now, let us talk about what each option can change, but I think that everyone with a basic common sense could get it.
- Background: Changes colour of the background
- Foreground: Changes the colour of the axis labels, for example time and price.
- Grid: Changes the colour of the grid, but to be honest,I don’t recommend to turn it on, it just bothers me.
- Bar up: Outline and wick colour of Bullish candle
- Bar down: Outline and wick colour of Bearish candle
- Bull candle: Colour of the bull candle body
- Bear candle: Colour of the bear candle body
- Line graph: It changes the line colour, if you haven’t selected the candlestick chart, but the line one.
- Volumes: Volume lines colour changes
- Ask line and stop levels: won’t be needed.
Now that you know how to set up the chart, so it’s clean and well-arranged, let’s have a look on some built-in tools for drawing in MT.
- The first tools is the vertical (up and down) line. It’s nothing more than an upright line that you can place anywhere you want. I mainly use it to emphasis the candles on which I have entered a trade and it’s expiration times.
- The second tool is the horizontal line. It’s practically a side to side line that can’t be turned or twisted. I mainly use it to draw the strike price to know whether I’m in or out. It’s also suitable to draw in support and resistance. More on this subject in one of our future post on technical analysis.
- Next tool is my favourite trend line. After selecting it, click anywhere in the graph and drag, this will create a half line that gets caught, by itself, on the nearest wicks, if we are trying to draw in a trend and miss slightly.
- Next two tools are made for drawing equidistant channels and Fibonacci lines, but we’ll talk more about those in one of our future episodes on tech. analysis.
- The other 2 additional tools are for text labels. I don’t know what they are for and it doesn’t even matter.
- By using the last tool, you are able to insert variety of symbols, such as thumbs, arrows, price labels.
Now, using the tools should be clear for everyone. If it isn’t, try it! Nothing can go wrong and everything is very intuitive, which makes it all much easier. After all, how do you think I’ve learn it? 🙂


