Today, we’ll talk about price formations that can be traded quite easily. There is a whole bunch of them and even though they do not appear as frequent as supports and resistances, it’s good to know something about them, so we don’t get caught of guard. These formations appear on all asset types, such as commodities or forex.
Formations that we’ll talk about are: double bottom, double top and head and shoulders. So, let’s get straight to it.
Double bottom / Double top

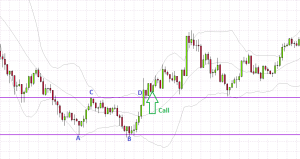
Figure No 1
This might possibly be the most famous formation that can be traded several times a day (using an M5 timeframe). The formation double top means that the price simply bounces twice (or more times) from one single resistance level. The general rule applies that the more bounces the price makes, the stronger the signal towards the trade and to a trend reversal.
A PUT trade can be entered right when the bounce occurs. But that’s a different approach than what we will talk about now. The thing is that when the price reaches the peak and bounces off of the resistance, it brakes the former bottom and will then continue in its direction.
The same goes for the double bottom, but vice versa. (See Figure No 1)
- Support line developed in point A
- Resistance line developed in point C
- A second peak reached in point B
- Point D shows us the break of the resistance, followed by the confirmation of the break, we invest on the increase of the price – binary option call
- The price continued to increase and our investment has finished profitably
When this formation occurs, it is likely that the trend will be reversed. Double bottom changes the bearish trend to bullish and double top, on the other hand, reverses a bullish trend.
Head and Shoulders Formation

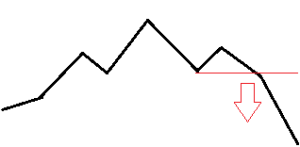
Figure No 2
Another formation is called head and shoulder, but it’s not that common. It looks exactly as it is called. See figure No 2.
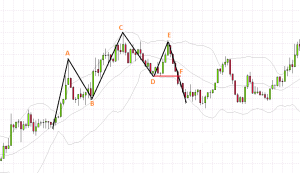
The black line indicates the price. We are looking for a peak, then a little higher peak and if the next peak doesn’t reach the same price as the previous one and the price brakes the last bottom, we invest on the decrease of the price. Preview in figure No 3.

Figure No 3
- First peak (our first shoulder) developed in point A
- First bottom, higher than the previous one developed in point B
- The highest top (our head) developed in point C
- Second bottom in point D
- Point E shows another bottom, a little higher than the previous one (our second shoulder).
- When the price, in point F, got under the level of the previous bottom (D) we invest on the decrease of the price – binary option put.
This formation changed the trend as well, even though it’s not a rule. You can also find it the other way around – “upside down”.
I hope that I’ve taught you something new today and that all your price formation trades will go according to the plan. If you have any questions, feel free to send them down in the comment section below. I read them daily!


