The market has bounced off a level you’ve never predicted and you don’t know how it is possible. Market volume or market profile may explain it. However, be careful; they are not a superpower tool. The question is how market profile and market volume can be used? Let’s look at their pros and cons.
What is market profile
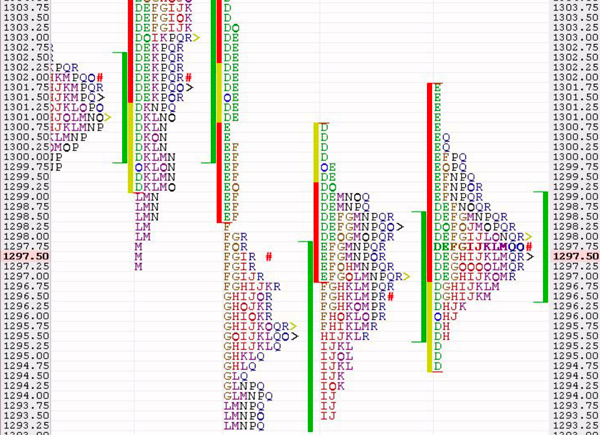
Perhaps you have already seen a chart with letters instead of traditional indicators. This is no magic, just a different way of displaying data. This technique was invented by Peter Steidlmayer (Chicago Board of Trade) in the second half of the 20th century and this invention made him famous.
Market profile monitors how many times a given price level is tested, how many times the market stayed there for 30 minutes. If the price is balanced for both the seller and the buyer you will see a series of letters, which means that the price is balanced i.e. fair for both parties. On the contrary, high is marked with one letter E which means that traders did not want to stay at this price as they did not accept it. It’s worth mentioning that a market profile has a typical timeframe of 30 minutes.
What market profile indicates
For instance, depending on the length of staying at a certain price market profile determines the equilibrium level to which the market tends to return. In other words, if on Monday the equilibrium level of asset A is at the price of 100 (…with the majority of letters there) and on Tuesday trades open at the price of 80, you may expect that it will reach 100 during the day.
100 should be resistance level and one could blindly trade for bouncing off back below 100.
I personally do not trade like this. If on a low time-frame, I always wait for a pattern to confirm my entry (see e.g. here Candlestick patterns). The market may overcome the price level of 100 to turn into a strong support level. Support and resistance are a backbone of trading, not only for forex traders. Don’t forget to draw them in your chart.
A market profile has already explained at least two moves of the next day: the growth of price from 80 to 100 and a new reversal at 100. Of course, market profile, like many others, is not a 100% guarantee. We recommend you confirm this in a shorter timeframe.
What is market volume?
Above we have explained the term market profile. If you replace profile with volume, one major difference will occur. Instead of the number of time segments, we will be monitoring volumes of trades. The rest of the logic is the same.
Market volume or market profile?
The choice is individual and depends on other aspects such as trading strategy and the type of instrument e.g. forex and EUR/USD. Test the technique of market volume and market profile on historical data and, based on the result, make a decision.


