


Today we will talk about thing which is equally, if not more, important than the trend line. We are talking about Supports and Resistances. I am asking myself, why did i not start writing about it sooner. 🙂
Concept of Supports and Resistances is one of the most discussed attributes of technical analysis ever. Today, we summarize what every beginner binary options trader should know, and if he knows already, it never hurts to remind ourselves.
Basics
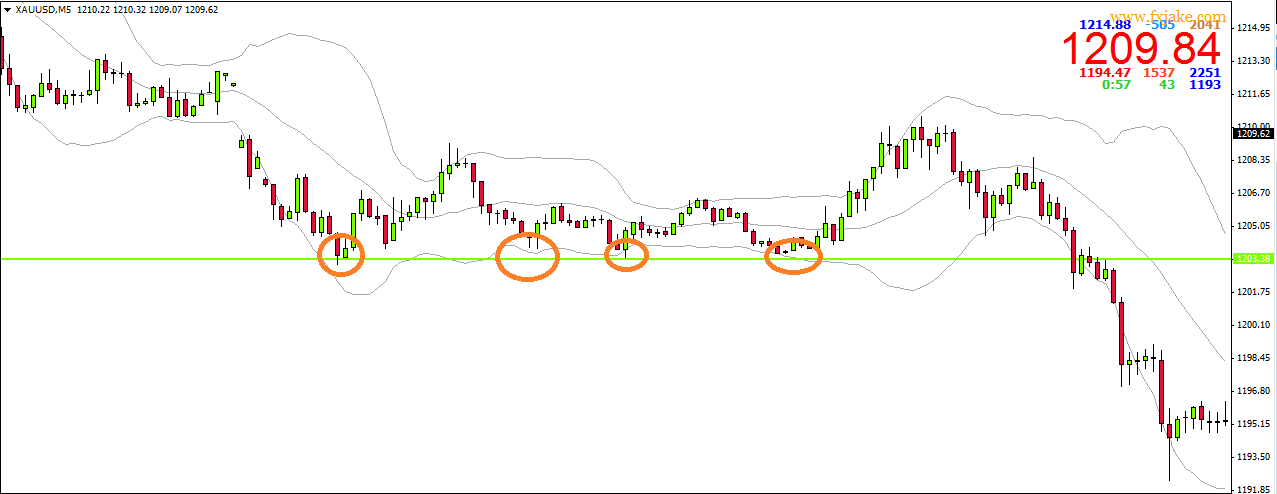
Image 1 – Example of Supports, click on the picture to enlarge
Support area arises at the place where the price is long-term bouncing up from approximately the same price line. On place like that we can draw the support. Example in Image 1. Thus, if the price of gold again reached approximately the area close to 1203.38, we could invest to CALL with expiration time of 15 minutes.
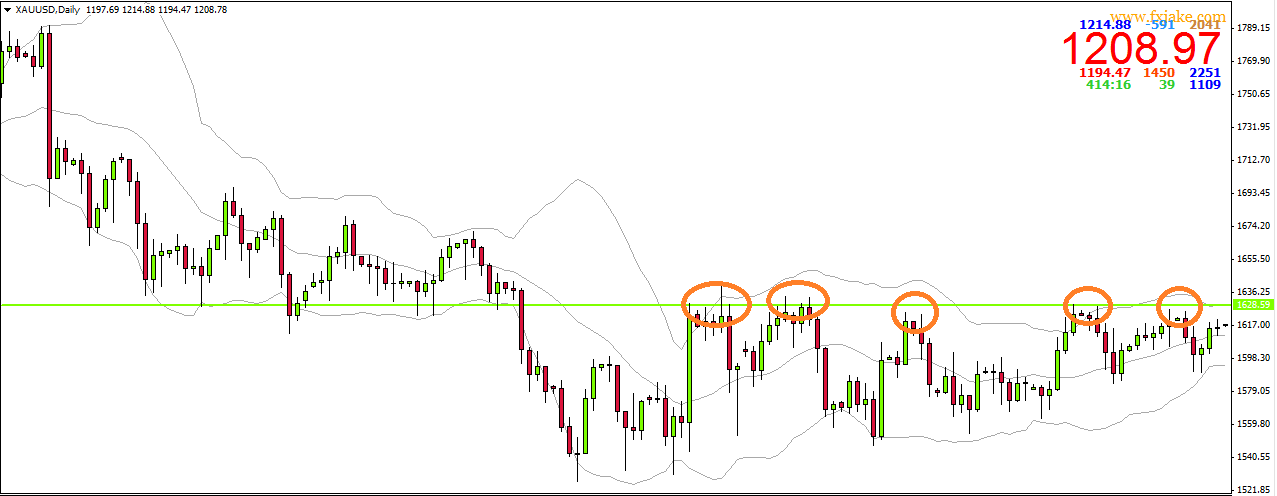
Image 2 – Example of Resistance
Area of Resistance is thus, as you can probably tell, formed in places where the price is long-term bouncing from the approximately same price line down. See Image 2. If, therefore, the price of gold were to again reach approximately the area close to 1628.59, we could invest in PUT.
Practically it is the same thing as the trend line. The only difference is that Supports and Resistances we try to find if the market stagnates, while the trend lines use the movement of the market (trend).
In practice it is mostly talked about the area of support or resistance, because it is (usually) not possible to accurately determine the value of support or resistance, but rather the area where support and resistance occurs.
– source: en.wikipedia.org
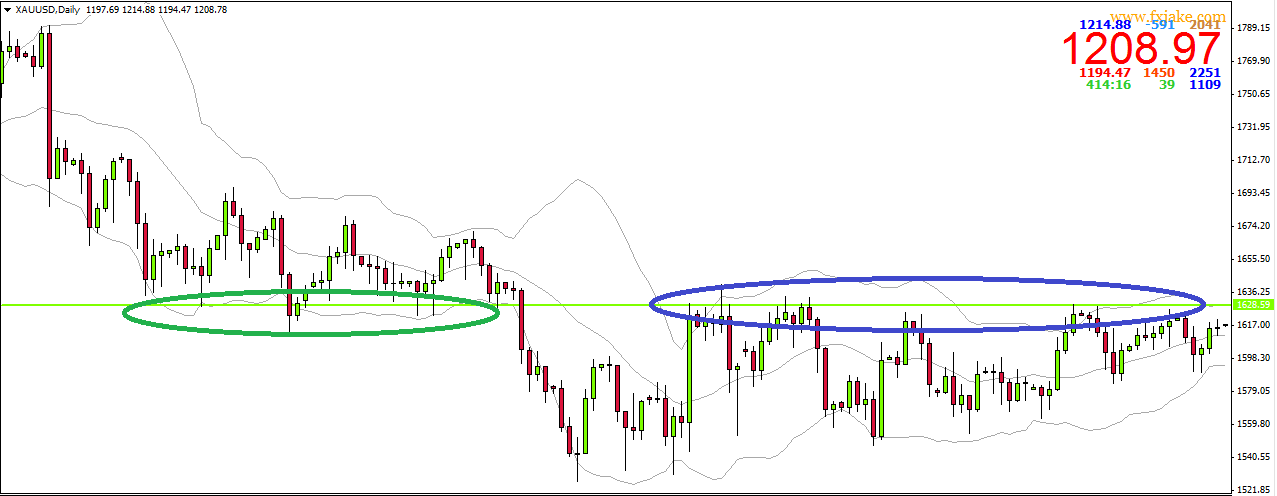
Image 3 – Green plotted support becomes resistance.
A very important moment arises during the breakthrough of support, or resistance, as it often happens that the are which functioned as a support until the breakthrough, suddenly becomes resistance and vice-versa. It is easier to understand on a graphic display, so check out the Image 3.
Supports and resistances can also tell us, when there will be a breakthrough of a price by a trend line and therefore, it would not be a good idea to invest according to a reflection from it (trend line). We will talk about this more, some other time.
Author

More about the author Step
I've wanted to build a business of some kind and earn money since I was in middle school. I wasn't very successful though until my senior year in highschool, when I finally started to think about doing online business. Nowadays I profitably trade binary options full-time and thus gladly share my experiences with you. More posts by this author
Thank you Step. Your articles have explained a whole lot for me. I was impressed by the simplicity of it all.