Now that you’ve come all the way to the part 11 of our technical analysis series, I assume that you’ve studied all the previous ones. If not, I recommend you to have a look – it’s all very important and every intraday trader should know about them.
We’ve already talked about support, resistance, trend line and fibonacci lines. That’s already a whole bunch of tools that you could use for trading, isn’t it? However, what you don’t know yet is that you’re still missing the most important thing – how to know whether the price will bounce off the line instead of breaking through it? In Part 8: Technical analysis show – The breakouts, we have talked about the complete opposite and that is how to confirm that the price has broken out.
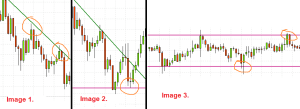
There are 3 basic types of reversals:
- The reversal with the trend where you can go along with it
- The reversal against the trend that is recommended only for the advanced traders
- The reversal with the stagnating trend that could be used with the short-term options

3 basic types of reversals
How to recognize and confirm a reversal
To realize that the reversal could happen is really easy. All you need to do is to draw in a right way the important price lines and the moment the price will come close to approx. 10 pips it could go right back whenever, in this case the reversal could happen.
To do so in the right way, to find out whether the reversal was real and not only a false alarm is not an easy thing. That’s why we need to learn to recognize the false reversals, so we don’t have unnecessary losses and the sooner we do, the better. We can recognize the reversals by two basic methods – using indicators or price action and using both methods together is the best.
Indicators method
The bounces can be seen very nicely using oscillators, such as stochastic oscillator or DSS Bressert, but also indicators such as ADX or by simply showing Volume.
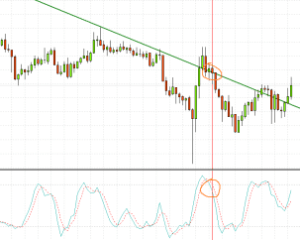
- Simple method using STOCHASTIC
- the oscivator breaks 80 or 20 lines inwards

A simple use of stochastic oscillator
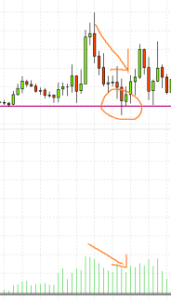
- Simple method using VOLUME IN THE GRAPH
– Volume is decreasing – > we could assume a real reversal

A simple use of volume
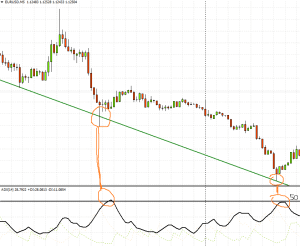
- Simple use of ADX Indicators
- If the main ADX curve is coming towards the line 50 we could soon await a reversal against the trend (it’s usually a short term reversal before continuing in the previous direction)

A simple use of ADX indicator
Price action method
You’ll find out how to confirm reversals using price action soon, in one of the following technical analysis series (Here: Part 12: Technical Analysis – Confirming price action reversals) Are you looking forward to it? Show it to your friends and share this article on Facebook!


This is really helpful thanks but i have a question.How can you avoid fake reversals? i find myself putting or calling a trade that looks like its going to reverse and then it keeps rallying in its original direction.how can I avoid this?
Hi Tanaka, I recommend not to trade before the reversal happens. The price should go back for at least 10 pips before opening a trade in reverse direction.
I enjoyed the article so much. Wouldd you happen to mentor people?
Dear Mamidza, yes, if I have time, I gladly respond to any questions either in my mail or beneath every article 🙂 Just ask away!