

Today I will show you how easy it is to read candle graphs, even though it may seem complicated.
What are candle graphs?
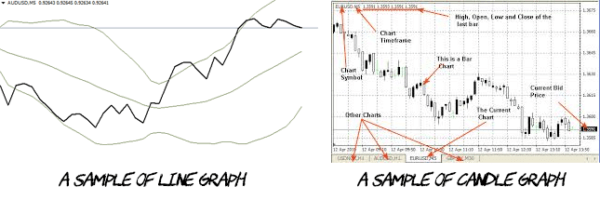
Surely we all know what a line graph looks like. It’s just a simple line that goes up and down depending on the price movements. Candle graph looks differently, but it shows us the same thing, and even more. In addition to opening and closing price each time period, the candle graph shows us also the fluctuation of the price, meaning how much the price has risen or fell during the specified time period (called a timeframe). If you do not know what I am talking about, read on!
Candle graphs have become the most preferred choice among all modern day traders.
For each graph, we can choose so called timeframe, which is just an option of how large period of time one candle represents. The most common choices for binary options traders are 1 minute, 5 minutes, 15 minutes and 1 hour timeframes. When trading binary options we will probably use mostly the first three. Other than that, people also use 4 hour, 1 day, 1 week and a 1 month timeframes. That’s not something you want to do when trading binary options, though.
Thus, if we are using the M5 (5 minute timeframe) and see 20 candles on the graph, each one representing 5 minutes, we can see all the price movements in the last 100 minutes.
How to read candle graphs?
Candles are divided into two types – BULLISH (rising) and BEARISH (falling). Therefore if we see a bullish candle, the price is
rising / increases and vice versa. The size of the candle shows us where the price started and where it evolved.
Each candle has two wicks. Wicks represent the fluctuation of price, meaning how high or low in the given timeframe the price has gotten, but did not stay there. The wicks are represented by a line, where as the candle body itself looks like a rectangle.

Graph of price development using an M5 timeframe.
- A – Rate, where the price started
- B– During the course of 5 minutes the rate has gotten this low
- C– And also this high
- D– After 15 minutes the rate was this
I hope I have explained everything simply, because it really is simple, but novice traders often seem to misunderstand. However, if you have any questions, do not hesitate to write me a comment below the article.
Author

More about the author Step
I've wanted to build a business of some kind and earn money since I was in middle school. I wasn't very successful though until my senior year in highschool, when I finally started to think about doing online business. Nowadays I profitably trade binary options full-time and thus gladly share my experiences with you. More posts by this author
Everywhere page I open that has to do with binaryoption or forex investments all have great customer reviews but when I tried investing with binaryoption, from plus option, to binomo to IQoption, I lost a lot. I still have someone helping me with my trades but I keep losing and now they want me to invest more money. I need to speak with people who have invested and had similar situations.
Very useful this information… Thank you so much… Hopefully i can use this in my trading…
Thank you.
We wish you good luck in the trading.
I appreciate your acticles, they are helpful, but l want ask because l like Japanese candlestick chart for trading, what can of strategy can l be using on it?
Hello, thank you so much for your comment 🙂 It really depends on what type of trader you are. If you trade daily or you open your positions for long term.
Hi I am new in binary. I find your articles very helpful.
Hello Chopper, thank you so much for your feedback! We really appreciate every comment like this.
Good luck in your trading. In case you need help – let us know and we will help you! Have a nice day.
Im asiking to send for me a graph of binary and application of binary via email
From the Moment I click the trade bottens, for how long is it valid?
Hi Clever. Depends whether you trade binary options or CFD. With binary options, you have to set the expiration time yourself, be it a minute, 10 minutes, an hour or a day. With CFD, you have to close the trade manually, meaning it will stay open as long as you want it to.
I am a new binary trader and don’t understand the principles of trading. I could really use your guidance
Hello, binary options trading is really simple I believe that you will understand it in a couple of hours. The whole principle is easy but to learn how to trade and make money is not that easy, you should really be careful. I highly recommend you to read our tips for binary options beginners.
Hello, although liked your teaching on candlestick strategies, I am a beginner and will need your help as I trade. Just registered yesterday, pretty new to binary, everything is like Greek, but I know with practice regularly on demo account, I will get it. Please how do I reach You? Thank you, sir.
Hello, we are happy that you like our trading materials 🙂 We are cooperating on creating of them with the high experience traders to deliver you as best value of information as we can.
With what you want exactly help? You can write it down here. Let me know so I can help you. Have a nice day.
Hello, I’m new to binary trading, and would like to learn more. Do you have other articles published?
Thanks for the heads up!
Hello, just check the website, we have there more than 250 articles about binary options trading.
I recommend you to start with this – tips for binary beginners.
Let us know if you have any questions, we will help you.
I actually do understand more now. Thanks for all lectures so far, been quite helpful. Am a newbie, still a student and hoping to become a successful trader. Still trading on a demo account though. But it all seems still very complex. Would love as much help as I can get. Please do guide me