For today, I have prepared a short talking about the ADX indicator. It can be easily used for your bussiness strategy.
Average Directional Index is an oscillator, that shows values between 0 and 100. These values show the strength of the current rising or falling trend, or confirms non-trend market. Values around 20 indicate weak / stagnating trend, whereas when ADX indicator shows a value around 50, we have a strong trend going on and values over 70 are very rare and mean a truly strong trend.
ADX curve itself does not show us whether this is a trend of decline or rise, but there are DI curves for that, in addition we should be able to identify if the price rises or falls by ourselves by now. If the ADX curve grows, the strenght of the current trend rises also and vice versa. +DI and -DI curves can also serve as a small signal to enter the trade. More on this in a different article, though.
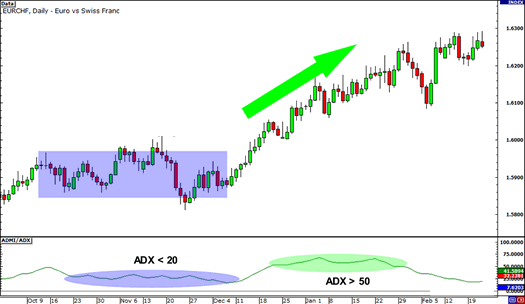
This version of the indicator is a little older and does not contain DI curves, but it will still serve us. In our case the ADX curve kept orbiting around the value of 20. Therefore there was no trend to speak of – the price was stagnating. Out of nowhere, the price has gone into uptrend and the ADX indicator rose to levels over 50. Do we understand how the indicator works, yet? 🙂
ADX indicator comes with one problem. It will not tell us exactly when to enter or exit a trade. What it tells us though is, whether it is a good idea to enter a trade with the direction or against the direction of the trend.
How to trade using the ADX?
There are two ways you can trade using the ADX which are: against the trend or with it. However that is for a longer talk and we can look forward to it in a different article.


One Response to “Part 2: Technical Analysis – How To Use The ADX Indicator”