


Because our technical analysis show here at the website has become very popular, today we are continuing with our 19th article. In this part, we will explore two basic elements of the technical analysis, both simple albeit efficient. If you are preparing your trading strategy or just want to get a better grasp of the behavior of the Forex market you should certainly read the article.
What is consolidation
If you look at any chart (currency pairs, shares, cryptocurrencies) you can identify a trend, retracement (correction) and consolidation. Consolidation is a sideways movement; the market is not in a trend or undergoing a retracement. Consolidation is typical by having to mark an upper and lower limit in the chart.
Consolidation often ends with a triangle-shaped pattern, a wedge. This is another simple but useful price action pattern (we will focus on it in the next part/s of our series).
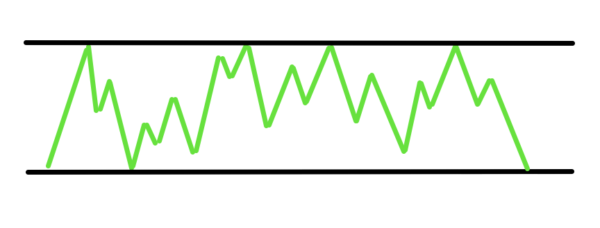
Price consolidation in a chart may look as follows
How to trade consolidation
There are numerous ways how to trade consolidation. As a true Forex trader you should make a test on historical data. The most frequent occurrences include rebound from lower/upper limit back to the range and/or waiting orders in case of leaving the range, when in trend. Reactions can also be seen outside the consolidation range for instance on significant levels of Fibonacci retracement.
What is divergence
Divergence is a phenomenon typical for indicators. Divergence occurs when an indicator (typically MACD or RSI) and the price of an instrument are heading in opposite directions. To easily identify this occurrence I recommend that you watch the trend line (both on the instrument and the indicator).
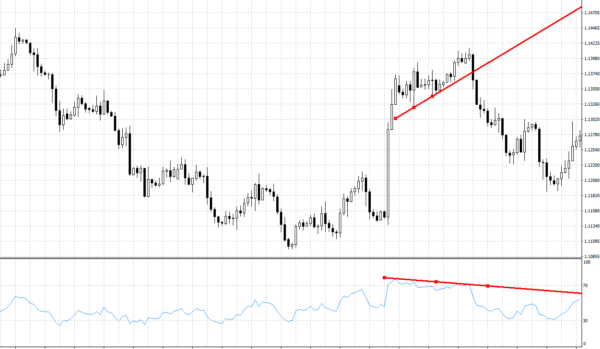
Divergence illustrated on a chart
How to trade divergence
If you manage to discover divergence you are halfway through to win. This is quite a strong trading signal, indicating a trend reversal. Watch the price chart and be ready that an opposite trend or at least the correction of the current trade is about to start.
The two above patterns of the technical analysis are fairly simple and, most importantly, powerful. If you don’t believe make a test on a set of historical data. Another advantage of this pattern is that they occur in the Forex markets relatively often and as long as your portfolio of currency pairs and time zones (5/30/60 minutes etc.) is broad enough you are likely to come across the two phenomena – consolidation or divergence – nearly each day.
Author

More about the author J. Pro
Unlike Stephen (the other author) I have been thinking mainly about online business lately. I wasn't very successfull with dropshipping on Amazon and other ways of making money online, and I'd only earn a few hundreds of dollars in years. But then binary options caught my attention with it's simplicity. Now I'm glad it did because it really is worth it. More posts by this author