Fibonacci sequence is a well-known term not only among technical analysis traders. What about you? Did you know this term? Let’s take a short look at the technical aspects of the Fibonacci sequence, various modifications that can be used and the way the sequence is displayed in a chart.
Fibonacci sequence
In mathematics, the Fibonacci numbers are the numbers in the following integer sequence, called the Fibonacci sequence, and characterized by the fact that every number after the first two is the sum of the two preceding ones. The fibonacci sequence starts with zero and one and, before you look at the below line, try to guess the next numbers.
0, 1, 1, 2, 3, 5, 8, 13, 21, 34, 55, …

How Fibonacci sequence relates to the Forex market?
Although our magazine is dedicated to trading, it might be of your interest to learn where in nature the Fibonacci sequence can be found. A few examples:
- Look at the number of petals: Lilies and iris have 3 petals; buttercups have 5 petals some delphiniums have 8; corn marigolds have 13 petals; some asters have 21 whereas daisies can be found with 34.
- If you cut a banana in half you will see 3 segments across the middle. If you cut the apple you will get 5 segments from the middle.
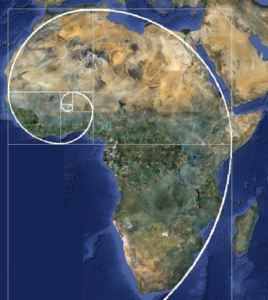
- The shape of a Nautilus shell is one more illustration of the Fibonacci numbers. Other examples include the African continent and many more.
Fibonacci sequence in trading
How to use Fibonacci numbers in trading has already been described in one of our previous articles. (The link is shown at the end of this text). Now, let’s refresh some typical illustrations of the Fibonacci sequence in a market.
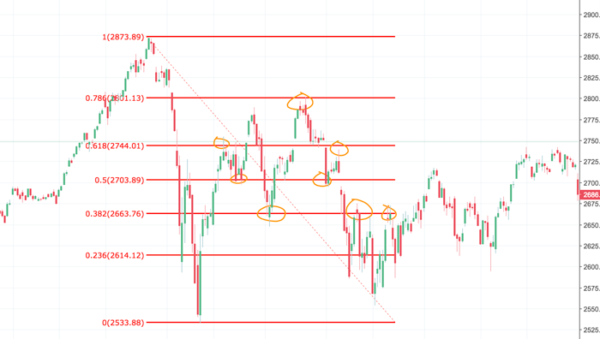
Most traders (including me) use Fibonacci primarily for identifying middle-term low and middle-term high. Then they connect the two lines and, following the Fibonacci principle, draw support/resistance lines in relevant points. Look at the below picture showing how beautifully the lines work.

Fibonacci lines and price bounces demonstrated on the index S&P500 (timeframe 4 hours)
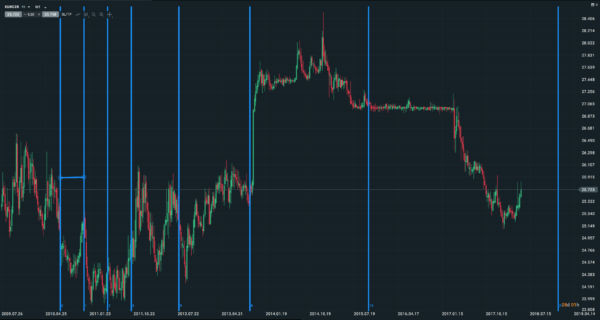
The same principle can be applied to time zones, showing potential moments of important price movements (see picture below).
There are various modifications of Fibonacci levels: Fibonacci lines, Fibonacci fun showing angles as well as Fibonacci channel. No matter which one you choose a common denominator of all is the Fibonacci sequence. Individual trading strategies employing Fibonacci sequence will be examined in one of our next articles. For the time being, try out to place the patterns on historical data. Can you see the reactions at the critical levels?

Fibonacci time zones
More details about Fibonacci numbers and how to use them in trading
TIP: Fibonacci lines have already been described in our articles. Relevant links are shown below.
- Part 24: Technical Analysis – Fibonacci Sequence
- Part 18: Technical Analysis – Using Fibonacci lines (video)
- Part 6: Technical Analysis – Using Fibonacci line (trade)
- Part 5: Technical Analysis – Using the Fibonacci Line


Fibonacci is the only tool you need, but the problem is effectively drawing it on charts 🙂
Hello Malik, if you have enough experience is not that hard. Anyway – Technical analysis is one of my favorite things and I use it more than the fundamental analysis.