In the previous episode we’ve talked about how to confirm a reversal from the important support or resistance lines using basic or advanced indicators. In case you haven’t read it, I should probably introduce you to the basics.
What is a reversal
In the world of binary options and trading as such, we consider a breakout when the price stops at the given line (for example a trend line or support and resistance lines) and after a bit, the price continues to move in the other direction than before. It’s important to state that these lines are never an exact value (i.e.: 1.20322), but it’s always a value around let’s say 10 pips each way. We’ve talked about similar things in our Part 8: Technical analysis show.
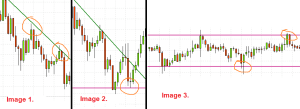
The breakouts can be divided into three basic types:
- The breakout with the trend
- The breakout against the trend
- And the breakout with the stagnation trend, recommended to be traded with short-term options

3 basic types of bounces
How to recognize and confirm a breakout
Realizing that the breakout could happen is really easy. All you need to do is to draw, in a right way, the important price lines and at the moment the price comes close to approx. 10 pips it could turn whenever, in this case the breakouts could happen. That’s why I was talking about an imaginary circle before.
To do so in the right way, I mean to find out whether the bounce was real is not an easy thing. That’s why we need to learn to recognize the false breakouts, so we don’t have unnecessary loses and the sooner we do, the better. We can recognize the breakouts by two basic methods – using indicators or price action and using both methods together is the best.
False breakouts could go in the same direction, it means that if we assume the downward direction of the bounce then the price will really turn and red candles will start to form. The problem though starts, when the trader enters a trade and the candle changes its mind, starts to increase and never goes back down.
Price action method
Using price action makes the confirmation of the bounces as easy as a pie.
- Simple method using PIN BARs
- If the price reaches the resistance line, we’ll wait until the next bar goes upwards, breaks the line and then starts to go back down. When a pin bar is formed and the next candle is bearish, we can talk about a confirmed reversal.

Simple pinbar preview
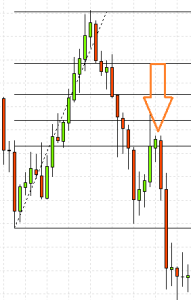
- Easy method using so-called pullback (more on pullbacks in one of our future episodes)
- The price breaks a given line (the figure shows a 61.8% Fibonacci line) and after couple of candles, comes back to the same line. Then, all you need is one candle going in the supposed turn and the confirmation is successful.

Pullback illustration
I think that these two methods should be enough for now, because these methods are the most used ones. I’m sure you’ll drop me a comment in the section below, if you have any questions. 🙂


