Today we will talk about breakouts. I will tell you, among other things, what breakouts are, how a breakout can be confirmed and how to expect one. If you have any questions, do not hesitate to type them down in comments under this article.
We’ve repeatedly said, that if a trader wants to increase his profits, they should catch/follow trends as soon as they can – and it’s safe – and keep watching it (trend) until such time when we get a signal for a trend reversal in opposite direction. Trend usually begins and ends with a breakout of supports and resistances or trend lines.
What is a breakout?
In the world of binary options and trading a breakout as such is regarded as a breakout when the price breaks through previously noted resistance and still rises up, or vice versa breaks through support and then keeps falling down. Breakouts usually indicate a change in supply / demand for the asset and usually start a new trend. That is the key reason, that makes breakouts a vital tool for all traders, who take trading seriously.
If a trend breaks in the way the trend is going, this phenomenon serves us as a confirmation that the current trend is still valid, meanwhile confirmed breakout in the opposite direction, than is the direction of the trend shows us, that the trend is likely reversing.
We must, however, be very careful of false breakouts, as they can often confuse us.
How to recognize and confirm breakout?
The first thing is, as we have said, a breakout of already established line of support / resistance. Another and equally important thing is to wait for confirmation of a breakout and not just a creation of false breakout.
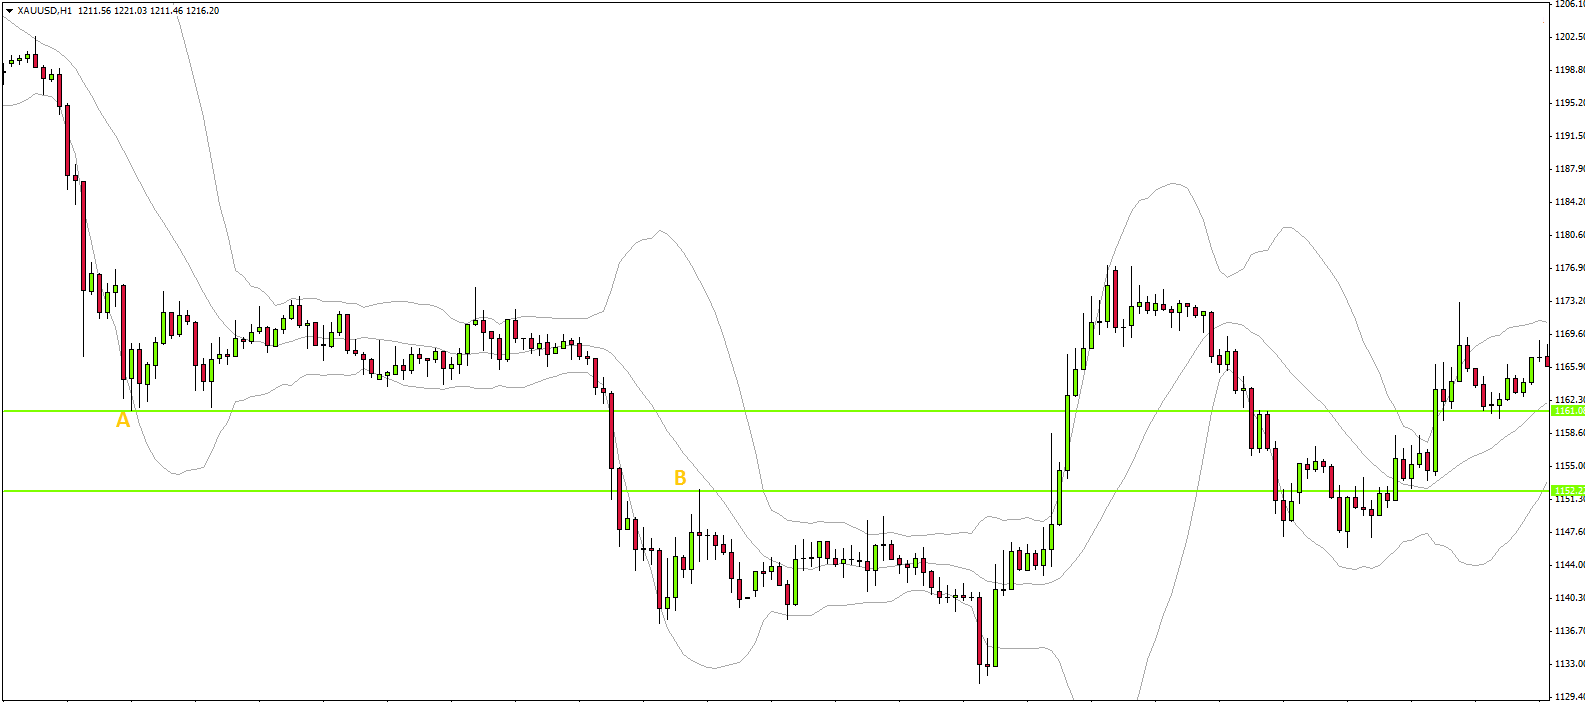
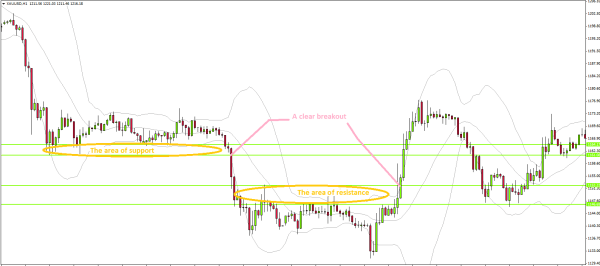
First, it is important to define a zone of support and resistance. (see Image 2) Then the minimum level for support and maximum for resistance. (points A and B in Fig. 1). It will serve us a level / standard for breakout.
If the price gets through these levels, we consider it a breakout in progress. Look at Image 2. Here, a false breakout is out of the question.
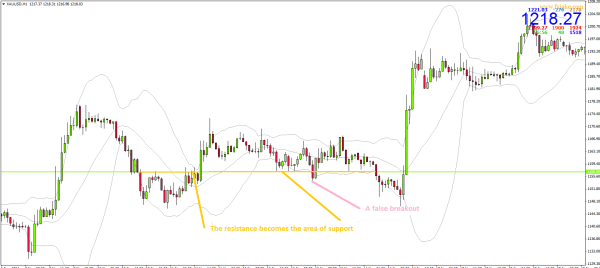
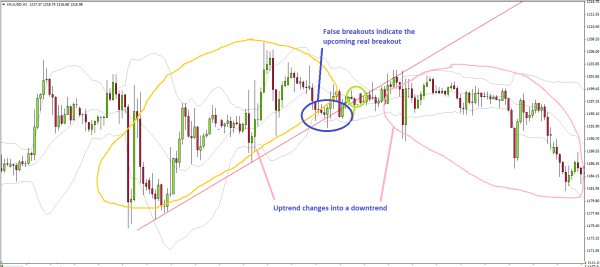
However, there is also a false breakout. This term is used to describe the moment, when the price gets past the level of our maximum support /maximum resistance and therefore acts as a breakout. After a while though, it decides to turn back. (Example in Image 3)
Some traders confirm the breakouts simply when the candle closes above the line of resistance. Others wait until another candle closes above. All that depends on your personality and temperament. Other traders wait for the price to cross our level by certain amount of pips.
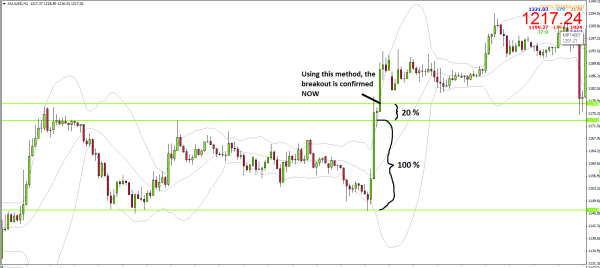
Another method of confirming breakouts is a breakout of another line, which is X percent away from our line of minimum support. Number X is chosen by each trader, again depending on their temperament. But usually it ranges from 9 to 20.
100 % is the distance from current support to current resistance. See Image 4
Everything we have just seen on supports and resistances works exactly the same for trend lines. Take a look at the example in Image 5. Do you understand? 🙂
Can we predict breakout?
Often we can predict breakouts, if we look at any volume indicator. (We will be talking about those next time)
If the volume increases with the trend, this means strengthening of the trend itself. When the price moves below the level of resistance, and the volume is increasing on all bullish candles and decreases on all bearish candles, there is a chance that it is going to our breakout zone resistance.


