This article was not written by me, I have received it as an e-mail written by one of the traders using BERSI 2.0 STRATEGY. I liked it a lot, therefore, I have decided to edit it a little bit and share it with you (with author’s blessing, of course 🙂 ) Let me know if you liked this article!
Using BERSI 2.0 strategy
I would like to dedicate this article to candles and their analysis for better trading. Methods, which I will explain today, can be used with BERSI 2.0 but also for drawing trend lines, lines of support and resistance, or Fibonacci lines.
Some of you may have experienced, that even if the indicator for trade seemed strong, the trade was not successful. Since I’ve backtested BERSI strategy for a long time and used other methods to raise its success rate, I have to say that after few weeks I’ve finally made it.
Personally, I search for trades in M5 timeframe and then open trades with 10 – 15 minutes expiration time. I’ve decided to share my experience with all of you – fans of Step’s website and his BERSI strategy.
Sitting candles
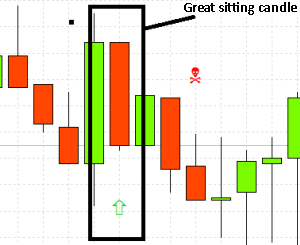
We now focus on what I call „sitting candles“: candles with a tall body but without wick and touching IB Weekly or Daily lines.

Sitting candle example
And what does this mean? As we can see, there has been an occurrence of Three Line Strike, but the price has reverted and went downwards even if the expectation was for the candle to go up.
This is an example of a sitting candle. This candle is rare and usually appears before the candle with an arrow (see picture for the illustration). In this situation, I do not trade as I do not know which way the price will go, because it is sitting on the daily line. And it could be broken (breakout) or the price might reverse. The exception is an IB Weekly, from which the price almost always reverses.
This is just a theory, but it has helped me to avoid many bad investments and thus saved my money. Therefore, a sitting candle is ideal for trading with Weekly IB, but not for Daily IB.
Weekly line breakouts
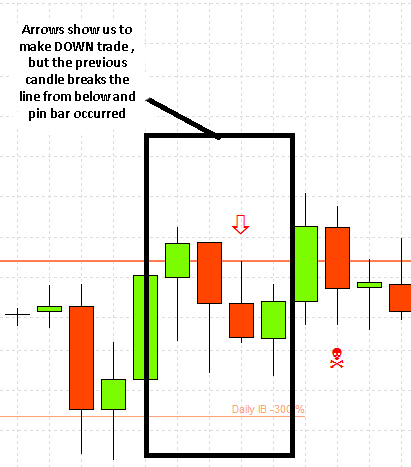
Another strong indicator is weekly line breakouts. This formation occurs often, but I think many traders don’t trade it because of the breakouts.
I do not trade this formation because of the breakouts and candle types. We could expect growth and reverse downwards, but this does not happen often.
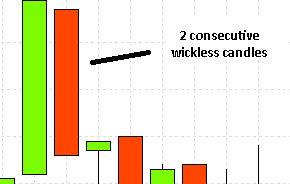
Wickless candle
Finally, what is a wickless candle? This formation occurs from time to time and I do not recommend to make trades even if the arrow is present. The wickless candle may indicate that price does not know yet which way to go and trading is, therefore, risky.
The trade might be successful, but in many cases is not. This is confirmed fact from my analyst as opposed to the previous two pictures 🙂 .
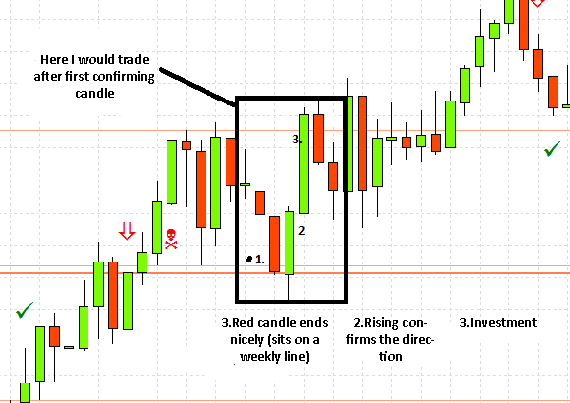
My trades
Ans how do I trade? I like trading Weekly line reverses the most. It is probably the strongest and best indicator of the overall strategy. It may be traded with or even without an arrow.
That’s all for today. And for those who do not have this excellent strategy: At least try it. Lines, not only arrows, play an important role in this strategy which will help you navigate the market.


