


In our today’s article, we will be talking about an indicator used by and popular especially among the beginners. The popularity stems from being part of many strategies available at various websites, forums etc. Therefore it is easy for a beginner to get used to using it and follow it in spite of not knowing what its values actually mean.
Would you like to know what indicator I am talking about? What values does it show? What do these values mean and how to use the indicator? Continue reading to learn more!
Stochastic oscillator
This oscillator has been with us for a few decades. It was first described by George Lane in the 1950s. Stochastic indicator does not show the price of a given asset or the volume of trades made. It shows the speed of price changes. These changes are translated into figures on a scale from 0 to 100, and can be easily plotted in a chart.

This is what stochastic oscillator looks like
As mentioned above, the picture clearly shows that the values of the oscillator move i.e. “oscillate” between the values of 0 and 100. This is quite simple. But what do these values represent?
It’s simply as follows:
- When the line (the value of stochastic oscillator) is at the top (nearing 100, let’s say, 80+) this means that the asset is overbought.
- When the line is close to the bottom (below 20, let’s say), we may assume that the asset is oversold.
Overbought and oversold
The two terms can be translated simply as follows: overbought means that the asset is being excessively bought, oversold meanst he opposite: an excessively sold asset. This is exactly what the stochastic indicator shows. It shows the current demand for an asset. These indications may mean two things:
We can either expect a trend reversal (…turning the overbought into oversold) or the opposite move – status quo for some period of time. As clearly shown in the picture below, both options may happen.
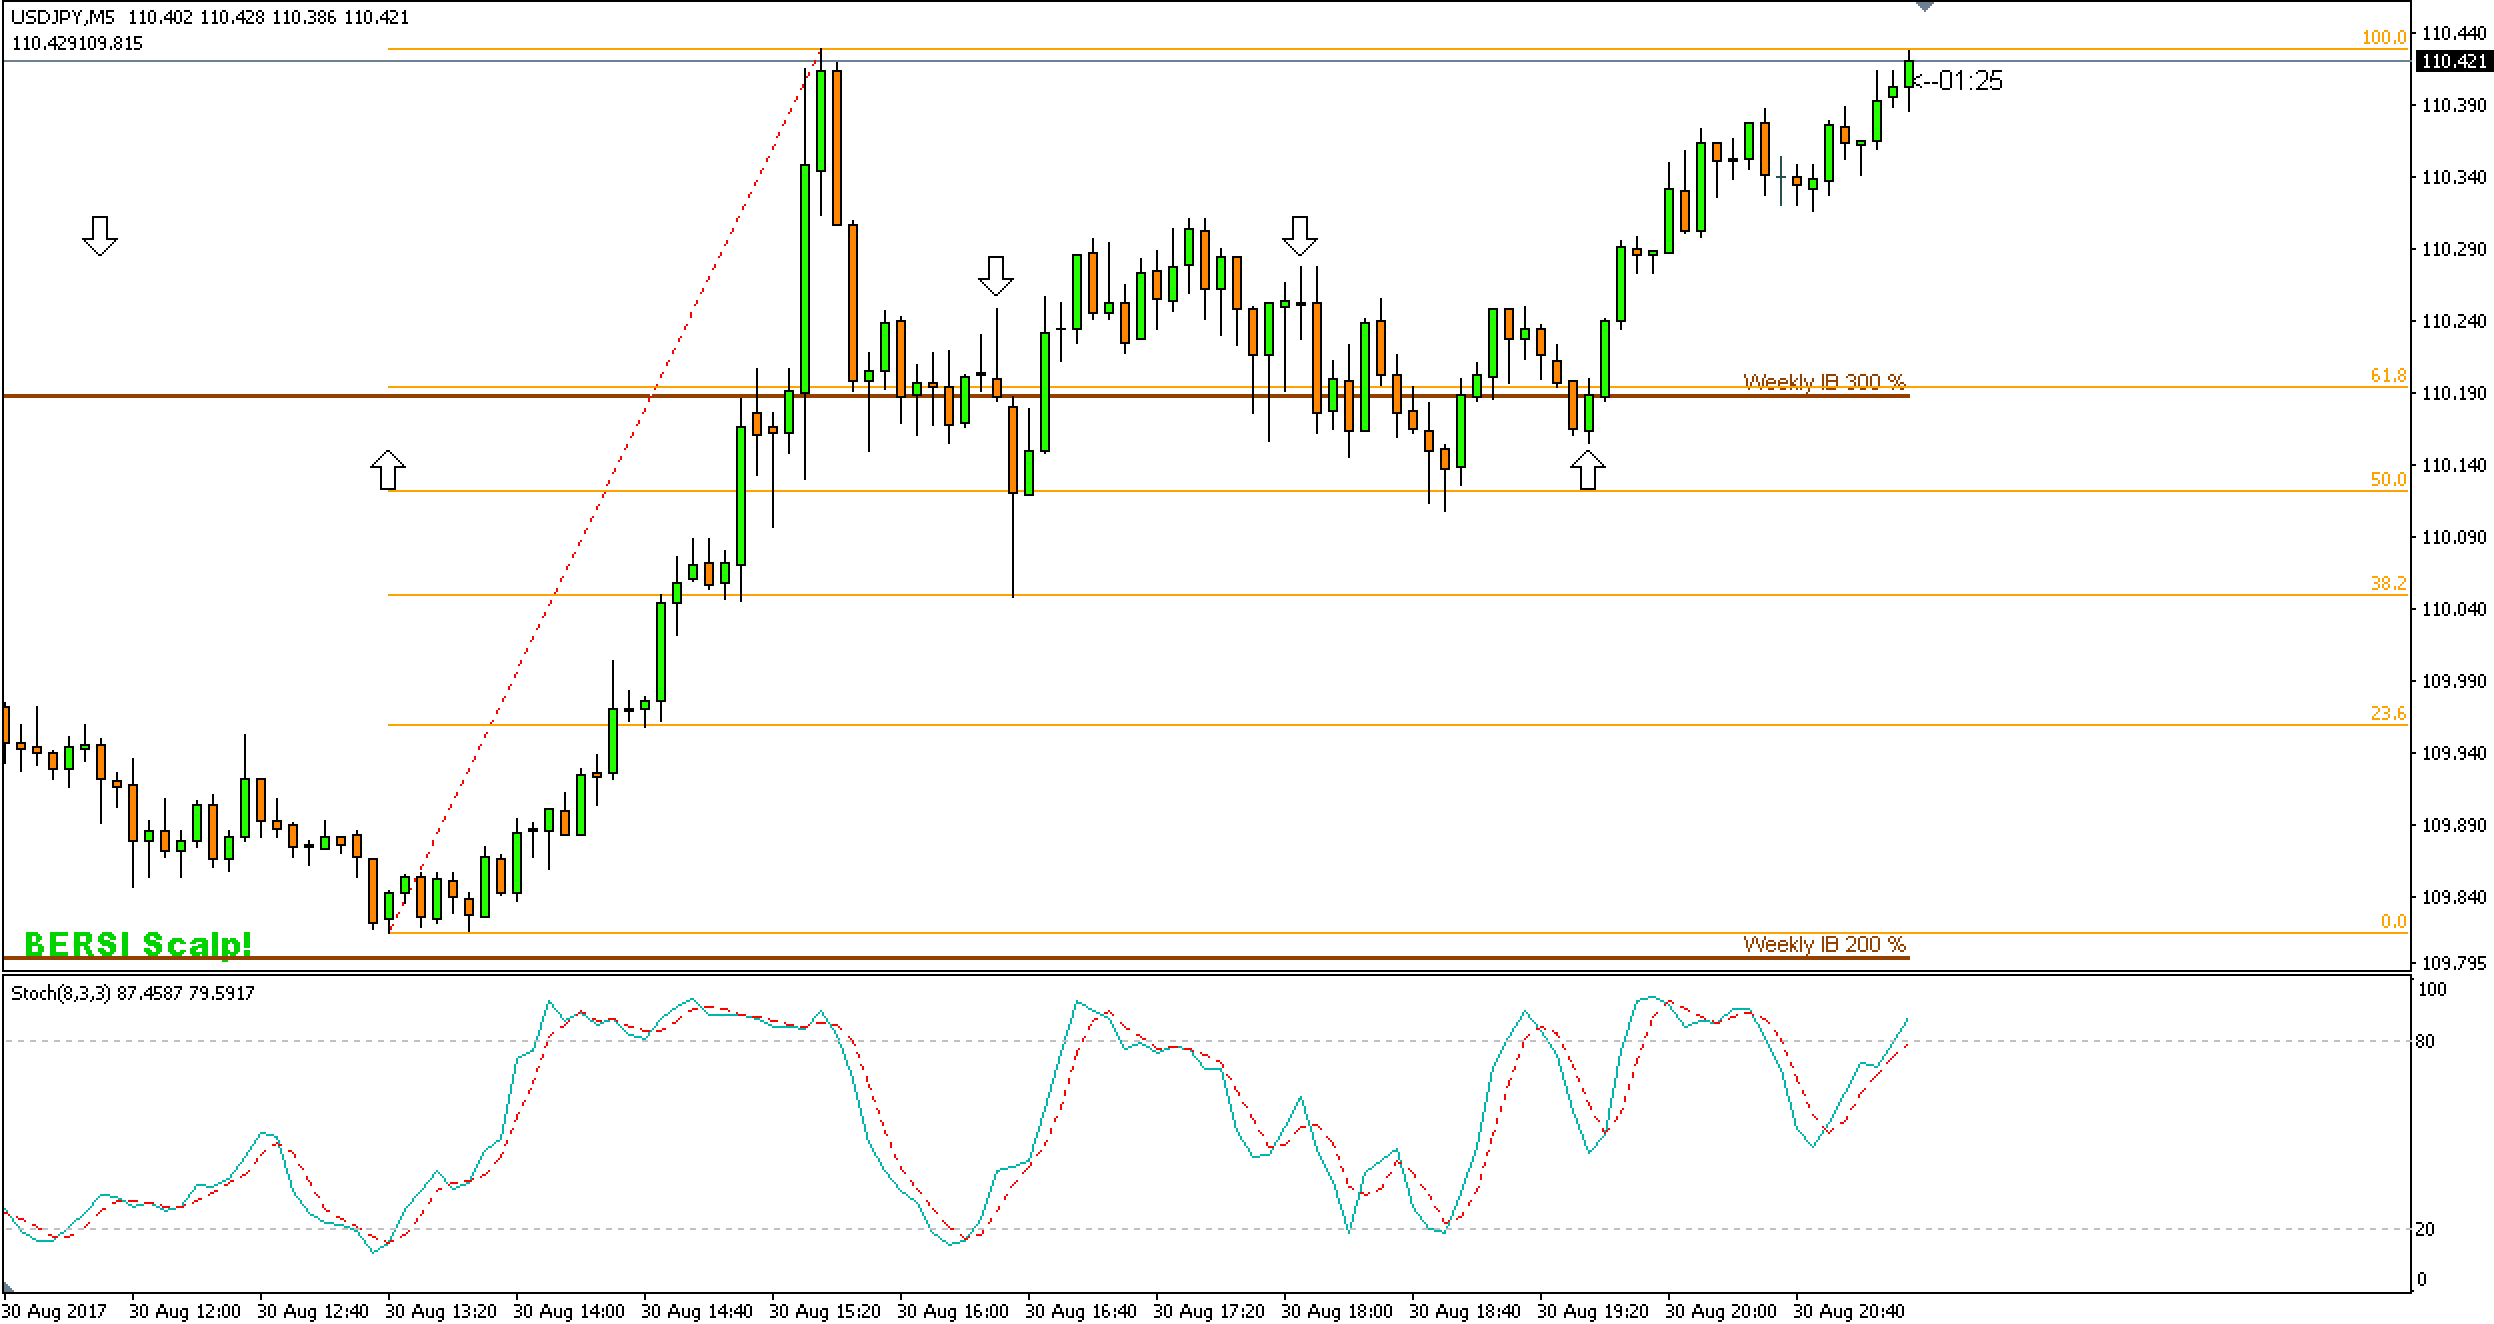
Ignore the arrows down at the bottom of the stochastic oscillator
As you can see from the above picture, both cases do happen.
- As soon as the oscillator falls below the 20 line (at the start of the Fibonacci lines) the price went up. An oversold asset has turned into an overbought, leading to an instant rise.
- After the first rise above 80, the values remained unchanged for pretty long and the buyers continued buying. Instead of going down, the price went even higher.
How to use stochastic indicator?
This indicator can be used in two ways. You can use it as a tool for trade filtering. You can either trade with the trend (prices changes following the long-term trend) or in the opposite direction.
Case 1:
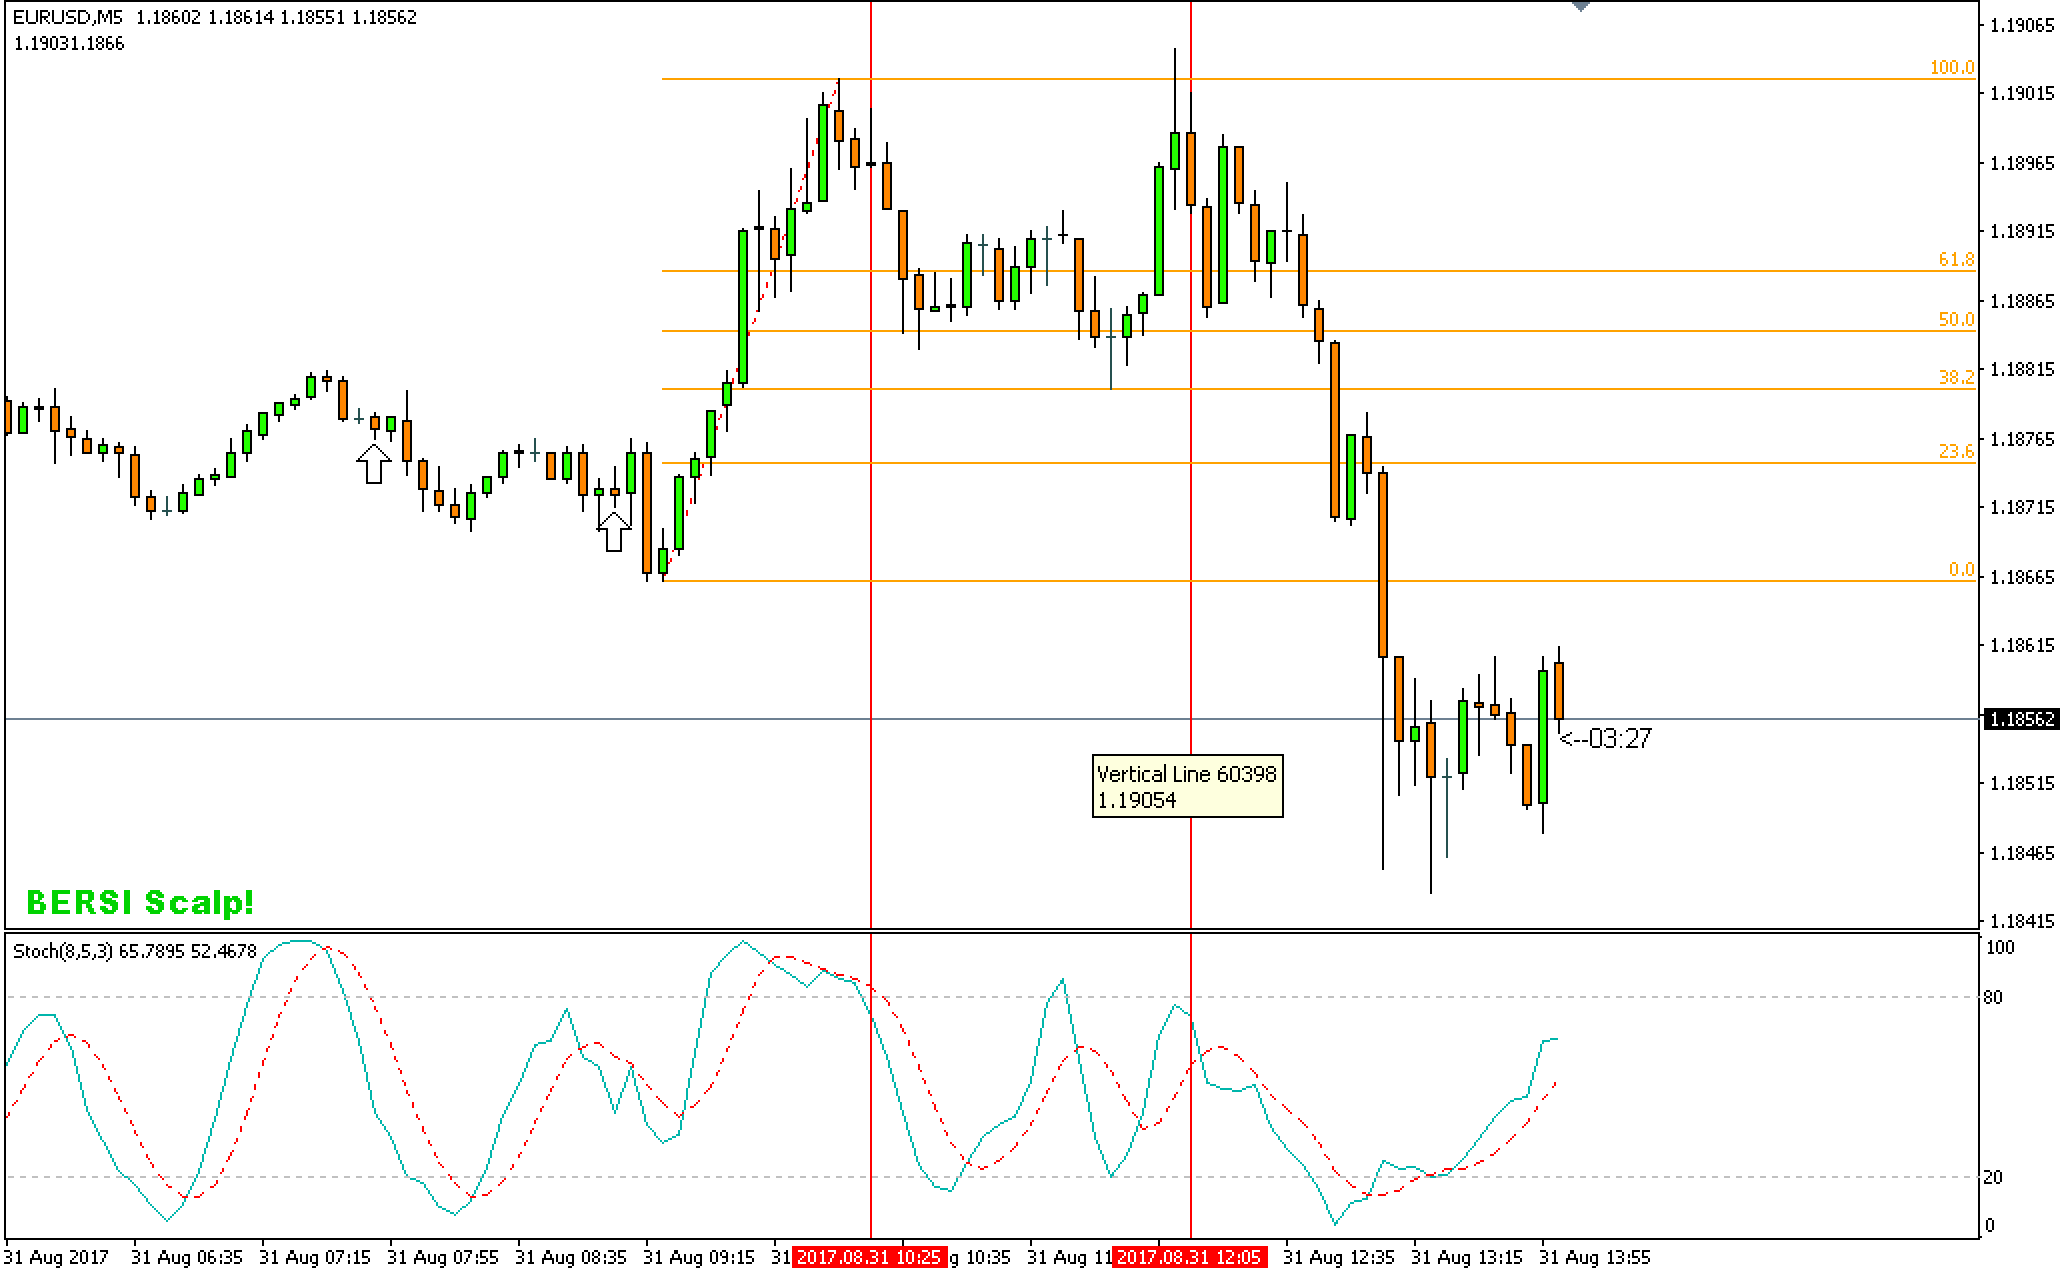
Case 1: Twin peak, 100% rebound Fibonacci confirmed by the reversal of Stochastic indicator
This case shows how you can use the stochastic indicator to confirm signals. On the chart’s left side, you can see two arrows produced by the BERSI Scalp strategy. If you had used the stochastic oscillator as a filter, you would have avoided these two losses.
In the middle of the picture you can see two vertical lines. The both mark the spot where the trend reversed. Using stochastic oscillator, you could have filtered and seen that the price would eventually go back down. How easy, isn’t it?
Case 2:
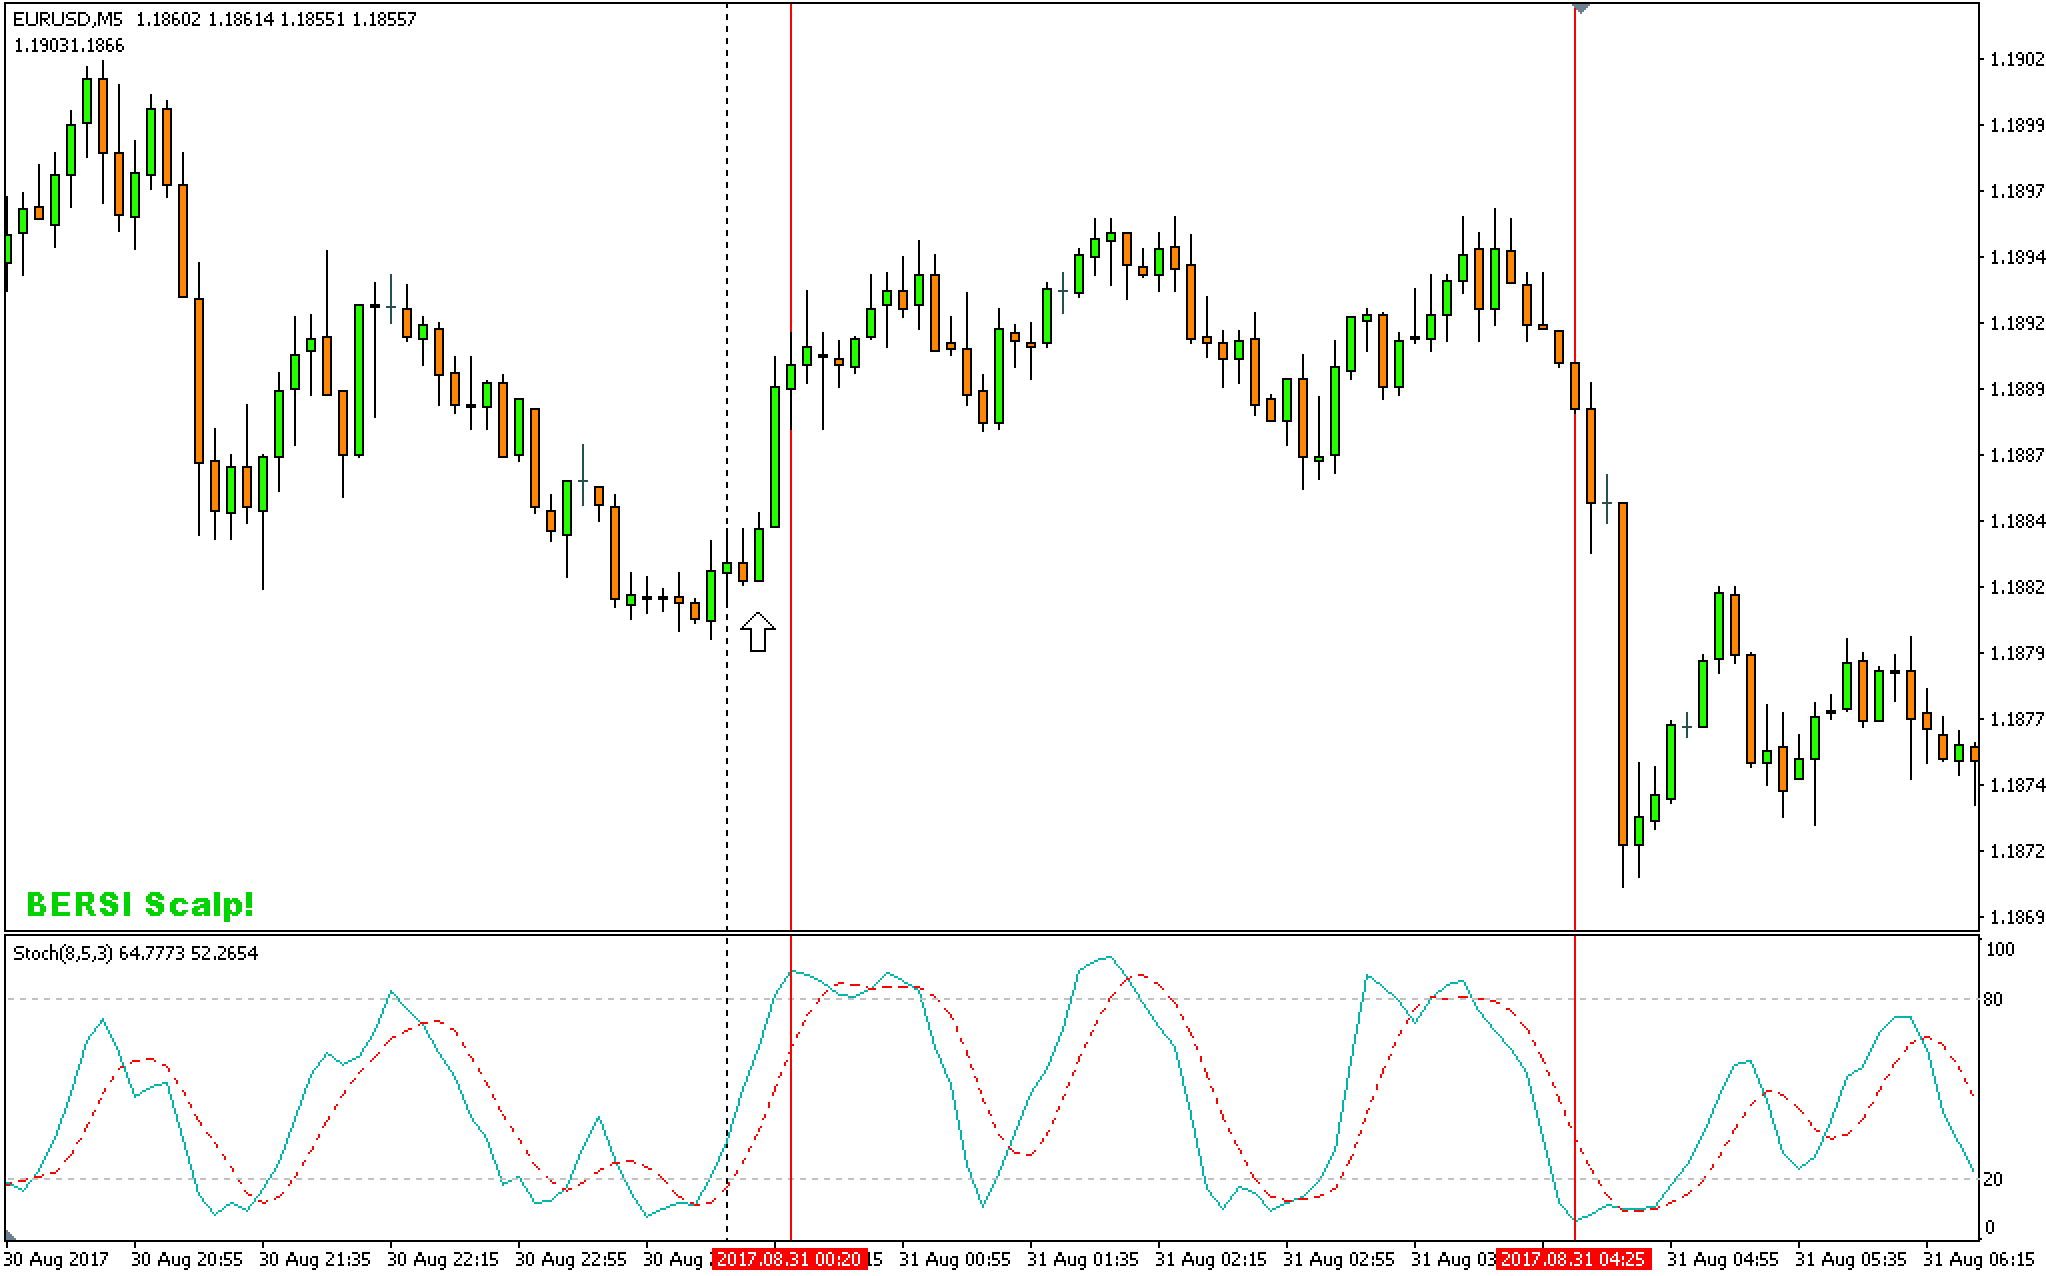
Case 2: Stochastic indicator confirms continuing trend
In the second case, as you can see above, you can see the price once sharply go up and secondly plummet (both highlighted by vertical line).
The stochastic indicator shows that in one case the price is oversold and in the second, overbought. There is nothing easier than to follow the trend of buying or selling traders. If you follow the current trend, you will surely profit.
The signal in case 1 is even stronger because it was boosted by the BERSI Scalp arrow. I strongly recommend you to put Scholastic indicator in your arsenal.
More information
My personal recommendation is not to use the stochastic oscillator as the only signal for opening a trade. However I do recommend it for filtering. If you are about to open a trade, seeing some formation in the chart (or a signal in another strategy), you should first look what the stochastic indicator indicates. If the indicator does not confirm the move in your direction do not go for it. Instead, wait for a while for the next signal.
Thanks to filtering you can separate the good and the bad signals only to trade when the signal is strong enough i.e. to confirm by multiple indicators. The stochastic indicator is not the only indicator one should use as a filter. You can also use the ADX Indicator or RSI.
Further reading
Stochastic oscillator (stockcharts.com – more “scientific” explanation of indicator)
Binary options strategy that works (best binary options strategy.com – one of good TA strategies using stochastic oscillator)
Confirming rebound by indicators (xbinop.com)
Author

More about the author Step
I've wanted to build a business of some kind and earn money since I was in middle school. I wasn't very successful though until my senior year in highschool, when I finally started to think about doing online business. Nowadays I profitably trade binary options full-time and thus gladly share my experiences with you. More posts by this author