In today’s Technical Analysis Series, we shall take a look at the Head and Shoulders price formation (Head and Shoulders – H&S). It is a very specific scheme capable of reversing a trend, much like a double top. H&S is less common; however, it has a higher completion rate – in conventional markets, this pattern reaches its target in about 85% of cases.
The name of the price formation implies a lot about what it looks like – the price creates a peak (left shoulder), then a higher peak (which represents the head) and finally a lower peak (right shoulder). But the peaks are not the only thing that matters. The most important part is the so-called neckline, which is the support level to which the price must return after the creation of each peak.
The assumption of the formation is such that if the market completes the formation (see below), we can expect a fall in price.
The whole thing is better illustrated in the following scheme:
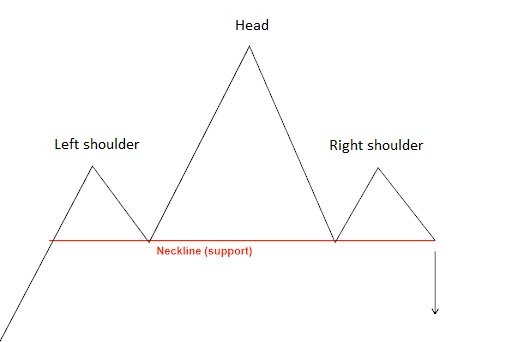
Basic sketch of the Head and Shoulders Formation (Head and Shoulders)
Completion of H&S formation
Very much like with the double vertex formation, in order to consider the Head and Shoulders formation complete, the price must return back to the neckline when the right shoulder is completed and breakthrough this support. It is therefore necessary for at least one candle on the monitored timeframe to close under the neckline, in which case the formation is considered complete and we should expect a further decline in price.
On the following picture, you can see what it looks in practice.
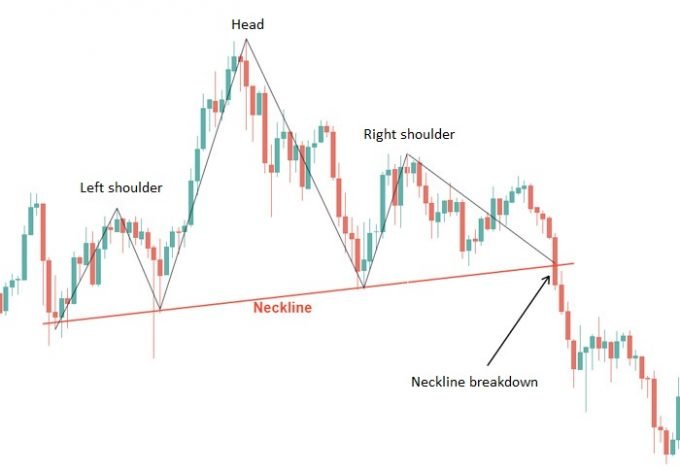
Head and Shoulders formation in practice – the breakdown
Traders often speculate on the price drop even before the neckline breakthrough. This is a mistake because regardless of the formation, the neckline is a support that can still bounce the price back up.
An example of this may be the following situation shown on the graph below, where the H&S formation had actually depicted, but then the price bounced off the neckline and continued up higher.
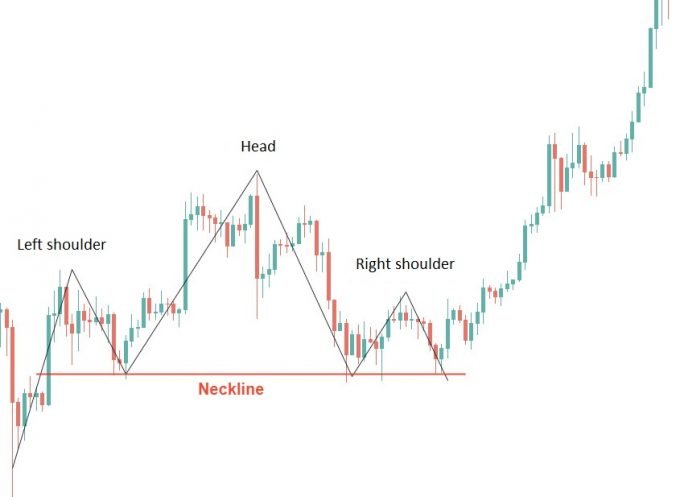
The Head and Shoulders formation in practice – the Bounce
Inverse Head and Shoulders formation
The opposite version of this formation is called the Inverse Head and Shoulders formation. In case of this formation, the market shows us the possible bottom and the bounce. The look and all the rules of the inverse formation are exactly the same as of the classic version of the Head and Shoulders formation (see the following figure).
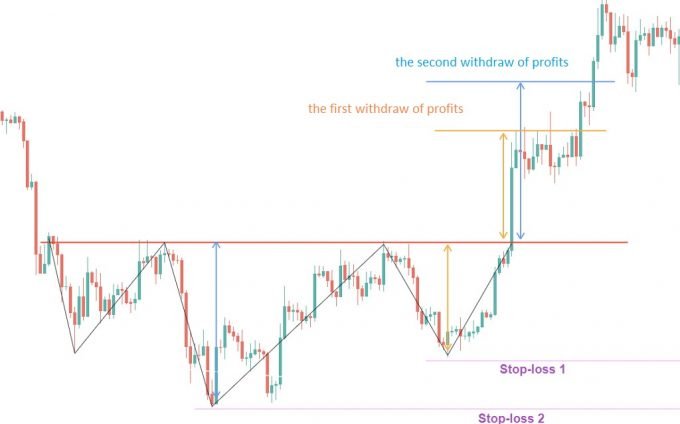
The Inverse Head and Shoulders formation
Variations of this formation
In this article, we have so far only gone through ideal examples. In real trading, however, you can encounter primarily two other different variations:
- Inclined neckline
- Non-symmetric shoulders
Both of these variations are very well illustrated on the example of the Inverse Head and Shoulders formation as seen below:
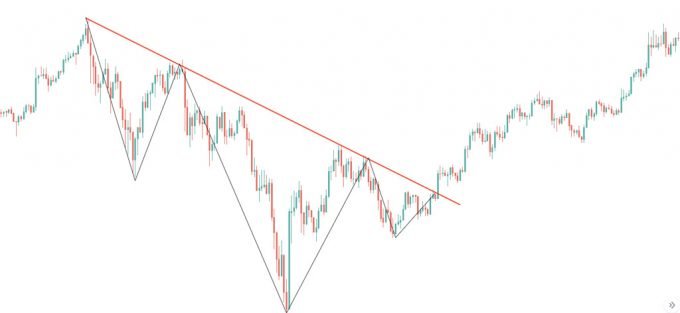
Variation of Head and Shoulders formation
The important thing to know is that even if both variations ruin the appearance of the formation, it doesn’t really matter as even in this case, the formation is absolutely valid once it goes through the neckline.
Utilization
In most cases, this formation is known primarily as a reverse pattern, one which is reversing the direction of the trend. So, if we consider a downtrend, at the end of which the Inverse Head and Shoulders formation appears, we can expect this formation to reverse the trend; at least in the short term. The following image serves as an example:
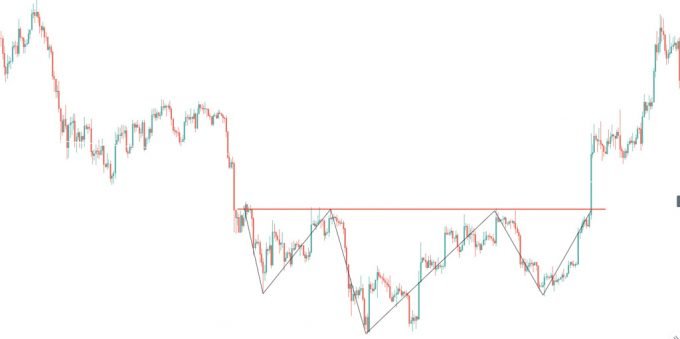
The Breakthrough of Head and Shoulders Formation in practice – reversing the trend
However, it is much less known that the Head and Shoulders formation (or Inverse Head and Shoulders formation) is an even better continuation pattern. This means that, for example, if we consider a trend going in the up direction with a pattern of Inverse Head and Shoulders formation as part of the correction, it has a higher chance of completing and reaching its targets than in the previous case.
Here is an example:
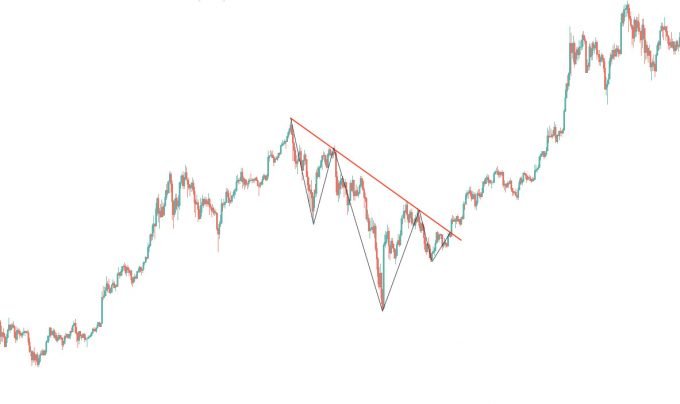
Reversing of a trend in the Head and Shoulders formation
How to place Stop-loss and Take profit orders
Sure – if you think you can estimate how the price will behave, you can open a trade and start making money. But how to set up such a trade?
The stop-loss order can generally be put in two places – either above the top of the right shoulder or up the highest peak of the formation, i.e. the top of the head.
You can also choose from two levels when placing the take profit order or use both.
- The first level for the take profit is obtained by measuring the height of the right shoulder – the distance between the top of the shoulder and the neckline. We will then transfer the same size to the point where the neckline was broken and consequently determine the value of the collection of the first profits.
- The second level is obtained in the same way, only the head height is transferred to the point-break of the neckline.
Let’s again show the placing of the stop-loss and also the take profit on one of the previous examples:
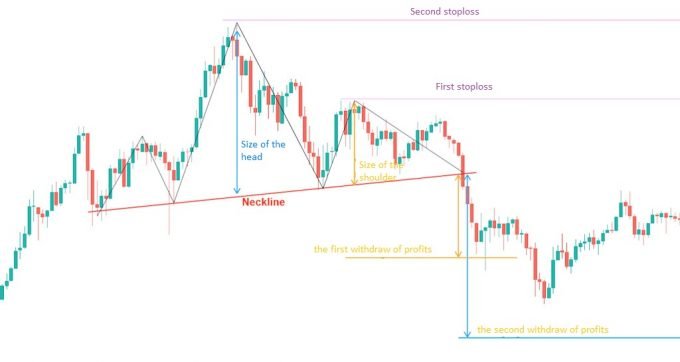
Stop-loss and Take profit Settings for Head and Shoulders formation
That’s all for today’s article. We hope that you have learned something new and that all of your price formation trades will go as planned. 🙂
If you’re not clear on something, please let us know in the comments below the article. We read them on a daily basis!


