In the previous episode of technical analysis (Part 10: Technical Analysis – Candle Formations), we described candlesticks formations, for example pin bar, and three line strike. Now it’s time to show you other candle formations. But first we need a bit of theory.
Trading candle formations
Trading candle formations is a type of trading using price action. That means trading strictly according to the price chart, i.e. without indicators. In this case we are using only price changes, candle shapes and candle positions – candle formations. When trading candle formations we also usually use trend lines – support and resistance lines.
Traders of price action consider that this is all that is needed for trading. According to them there is no need to use any indicators or other instruments, because they always just reflect what happened in the market in the past. Therefore they are useless and they only distract you from the real price and are unable to predict the future.
As a signal to open a trade position, we can use different candle formations from a chart (pattern and formations). We can map the actual situation on the market by price action analysis and by identifying quality patterns. Such pattern may provide us with a signal to open a position. If at the same time there are also other factors of the market which are in our favor, we can be sure that it is a very good quality signal.
Various candle formations

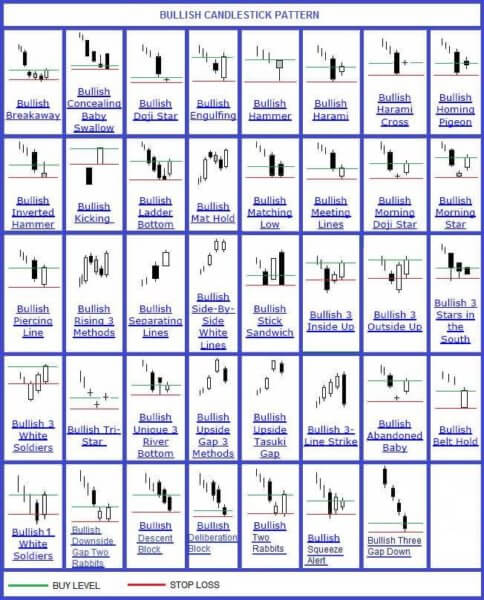
A few of formations that are formed during downtrend
There are dozens, maybe even hundreds of various candlesticks formations. I would even say that most of them are nonsense that people invented just to make something up. See the picture above, which summarizes a little what everything you can find in a chart. However, we will focus on the candle formations that make some sense.
Morning Star and Evening Star formation
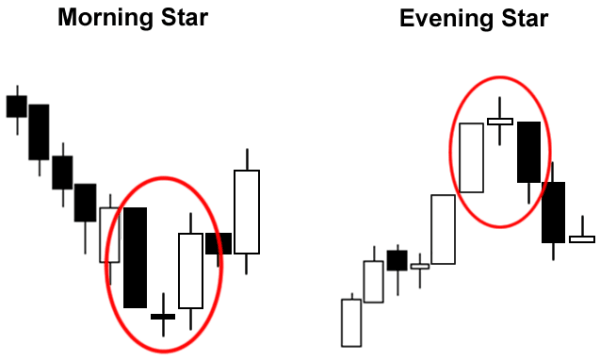
One of the formations which I love, is called Morning star. The morning star formation is formed during a downtrend. Its exact opposite – Evening star – is formed during an uptrend. Whether it’s one or the other formation, it is always a signal that the price is going to turn.
How can you recognize these formations?
- For the Morning Star:
- 1. The downtrend is obvious.
- 2. The body of the first candle is declining and it is relatively long. It is a continuation of the current downtrend.
- 3. The third candle shows whether the price started to rise. This candle should close over the half of the first candle.
- For the Evening Star:
- 1. The uptrend is obvious.
- 2. The body of the first candle is rising and it is continuation of the current uptrend.
- 3- The third candle shows whether the price turned. This candle should close under the half of the first candle.
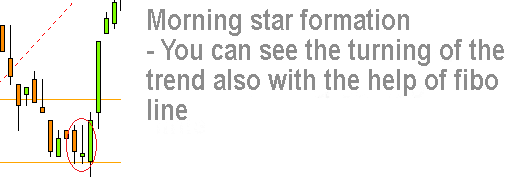
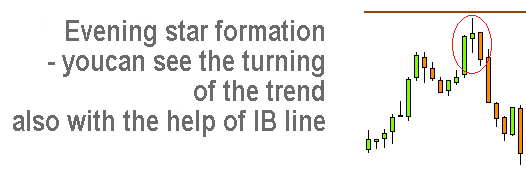
I’m not going to describe it too much, we can directly check out some examples in the charts and in the real world of trading. BTW if you want a cool article about it, check out candle formations strategies.

Morning Star and Evening Star candle formations

In both examples above you can see lines that help to distinguish when the trend reversal could happen. These lines are of course part of out successful strategy BERSI Scalp.
Do you want to know more about that strategy? Go to: http://bersistrategy.com.
Piercing Pattern formation
This formation can be used for the confirmation of the rotation. Although this is initially the downtrend reversal pattern, it is possible to use this candle formation also vice versa. Piercing pattern formation is very well shown in the video below, but for any case I am also going to describe it.
A video by IQ Option
- After a series of several (at least 5) consecutive candles going in the same direction we will focus on a series of candles going in the opposite direction. If in the second series we find at least three candles going in the opposite direction, we can invest on the rotation.
- This formation is even stronger when the price bounces back from, for example, a supporting line. On the other side you have to be careful that it is not just a throwback.
Trade on a demo account from IQ Option in 3 minutes.
| Broker | Info | Bonus | Demo | US Traders Allowed | Open Account |
|---|


This is my first time reading your article and I like it.