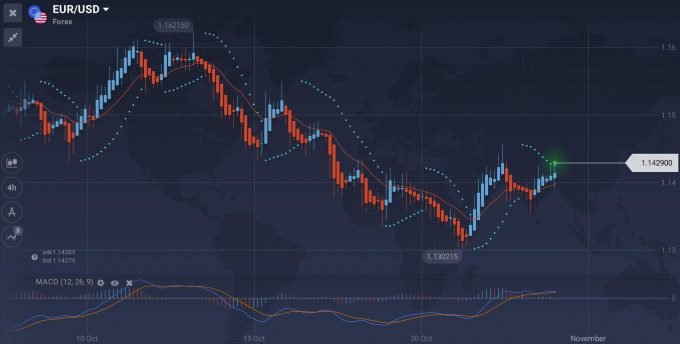
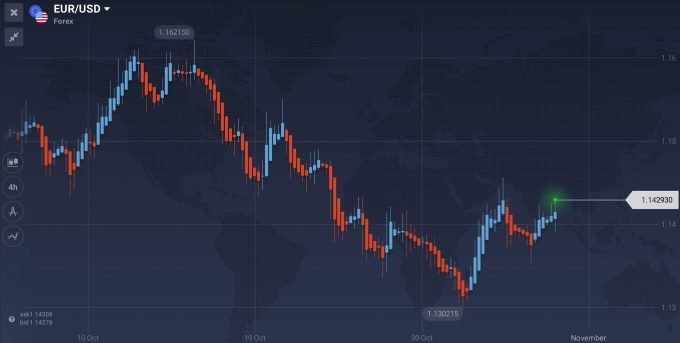
The efficiency of one’s trades depends on the use of varied technical analysis indicators. And the good news is that broker IQ Option offers its users a variety of tools and indicators to use in trading. As a beginner, the challenge for you is understanding these different indicators and choosing what’s best for your situation.
When faced with options, experienced traders recommend limiting it to two or three. You’ll find so many indicators but you don’t need many, for sure not all of them. In fact, some critical trading information can be gleaned on the price chart. In short, the use of indicators is not mandatory. However, these indicators can represent trading information in a different way and can be used to identify market movements or patterns.
Remember, these are just tools and their usefulness eventually depends on how you use it.

With IQ Option you can use up to 3 indicators at a time.
Some of the best indicators work the same way. Just take the case of RSI, MACD, and Stochastic. Although these are different indicators, they often present similar and overlapping information. Using these three indicators may not be helpful. You can simplify this by just using two moving averages which can substitute for MACD. The problem with overlapping indicators is that they offer similar signals and cannot be used to confirm one another.
Our suggestion is to select an indicator from each category.
Oscillators. In this category, the information from indicators will fluctuate between two lines, with lower and upper boundaries. Some examples of indicators here are the Commodity Channel Index (CCI), RSI, Stochastic, MACD and more.
Overlays. In contrast to the oscillators which are placed below the charts, the overlays are placed directly on the charts. The indicators included in this category are Moving Averages, Parabolic SAR, Bollinger Bands, and Fibonacci Retracements.
Combining Indicators – How to do that?
With IQ Option platform you can combine indicators based on your asset, trading style, and personal preferences. However, you need to follow some rules when combining indicators.

During strong trends, you can trade without the use of indicators.
To recap, it’s highly recommended to choose just one indicator for every category. To check the strength and direction, you can rely on MACD. And to identify the best entry and exit points, then the Bollinger Bands can prove helpful.
An Oscillator can be used together with an Overlay. Just remember that there are certain combinations of indicators that can work efficiently. And it’s possible that you can use at least two overlays at the same time. For example, some traders use Parabolic SAR with a moving average. If this is the case, it’s recommended that you should maintain your trading screen clutter-free. If there’s too much information, you may be distracted in fully appreciating the data. At the end of the day, these are just indicators and cannot deliver sure profits. Your skills and reading the indicators are still critical in transforming data to profits.
Remember, don’t use more than 3 indicators. To maximize the results, make sure you understand how these indicators work and the kind of information that you’ll get. It is only through this process that you can fully use these trading indicators to your advantage.
As we said above. These are just tools and their usefulness eventually depends on how you use it.
Start trading today – Read our IQ Option review!
| Broker | Bonus | Min Deposit | Payout | Review | Open Account |
|---|


