Volatility. A term very often used in Internet discussions, but also in books on trading and in trading courses. But what exactly is volatility? You’ll find out in this article.
What is volatility?

If the price changes fast and the price moves within a larger spread, then we’re dealing with high volatility. Conversely, if the price has been frozen at the same value for a long time, then we are dealing with low or zero volatility.
To understand the importance of volatility, it is critical to realize that it is a phenomenon that is constantly changing over time. Each financial instrument goes through a period of low and high volatility. Therefore, it is difficult to determine with certainty which assets are more volatile than others.
However, the general theorem is that:
- Stocks, stock indices and cryptocurrencies are the most volatile instruments;
- Stocks are followed by forex, or more precisely, major currency pairs such as EUR/USD, GBP/USD, USD/JPY or USD/CAD;
- Forex is followed by commodities.
You should approach this information with caution, though. Commodities, much like oil, can shock markets with tremendous volatility as much or even more than any other market stock…
Volatility is also a fractal phenomenon. This means that at any given price we see both larger and smaller price fluctuations over the years, months, and even within a single day. During the period of one month, for example, we can encounter nothing but low volatility, but at the same time, there could be a lot of movement in just a single day of that very month.
The period of an extremely fast price downfall is called a crash. The period when the price rises very strongly, on the other hand, is called a bubble.
Each trader and every investor automatically takes into account the volatility of the traded instrument, as it defines the expected spread of price movements and subsequently the period for which we want to hold and appreciate the given financial instrument.
What and when causes volatility?
Market volatility is mainly due to unexpected fundamental news, such as fresh central bank interest rate decisions, government tax, and budgetary decisions, inflation data, unemployment rates, but also international political events such as elections and referendums, world leaders’ meetings, war clashes and so on.
The more important players are in the market, the more volatility we can expect. Therefore, traders are experiencing the greatest price jumps during the working day because of the joint trading session of London and New York between 14:00 to 18:00 of Central European Time. By contrast, the lowest volatility in the market can be found when Europe and America are sleeping and trading only occurs on Asian and Australian exchanges.

Trading hours
Types of volatility
Usually, we distinguish volatility in terms of the selected time range. We are interested in the price fluctuations of the current volatility from a certain past day to the present day.
With historical volatility, we focus on price volatility within a period that is now completely in the past, such as Dow Jones’ volatility between 2000 and 2010.
With future volatility, we observe price volatility from this day to a certain future date, for example, until options expiration.
Why traders must be interested in volatility, or advantages and disadvantages
- The greater are the price swings on the graph, the greater is the nervousness of the market in terms of asset valuation.
- The current average price spread of a financial instrument helps to determine the size of the traded position or the holding period.
- Higher volatility automatically involves greater potential gain, as well as a greater risk.
- The higher yield volatility of our investment fund indicates a much wider range of possible portfolio outcomes in the future.
- Price volatility allows us to buy assets cheaply and sell them when they are overpriced.
Generally speaking, higher volatility benefits scalpers and intraday traders with aggressive and risky strategies. Many automated trading systems operate with a sudden increase in the average price spread. Trading systems based on breakthroughs of support and resistance zones also operate with volatility. Careful monitoring of volatility is recommended for this group of traders and systems.
But are there any disadvantages to volatility? Of course. As suggested in the text above, higher volatility carries a higher risk. Thus, conservative traders and cautious investors relying on positional and long-term strategies do not necessarily need high volatility. This group is mainly focused on securing a smaller percentage return, and therefore not interested in wild market behavior.

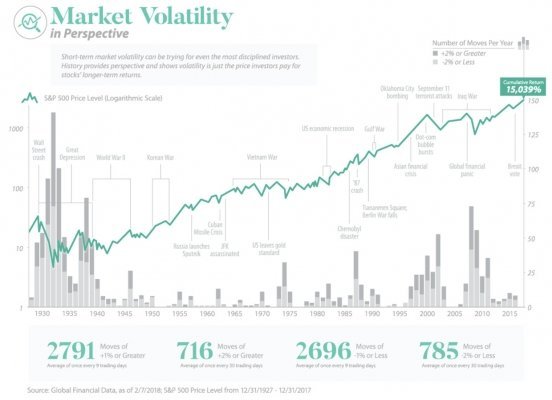
Market Volatility Perspective on the S&P 500 Index (Source: RitHoltz.com)
Volatility in practice
Example A
How to capitalize on average volatility when investing? Let’s say we want to invest in precious metals, but we don’t know whether to choose gold or silver. Let’s say that due to a strong positive correlation, the annual yield on both commodities is approximately the same – 5%.
Because of this, we should look at the information on the historical volatility of the assets. Let’s say that gold is on average 3%, silver 10%. This means that during the time we would hold gold in our portfolio, we should expect the maximum value depreciation to fall to about zero, while with silver we would be worried about falling deeply into negative numbers due to higher volatility.
In this case, most investors would choose to invest in more stable gold, although more volatile silver would imply higher potential appreciation.
Example B
How does the rate of profit on the S&P 500 relate to the average volatility over time? Crestmont Research had asked itself the exact same question back in 2011. The Institute found that higher volatility increases the likelihood of market downturns and losses, while lower volatility, in turn, increases the likelihood of a bull market.
Their data, gathered between 1962 and 2011, show that if the average daily price spread of the index is below 1%, there is at least a 70 percent chance of a profitable month and a 91 percent chance of a profitable year. If the daily volatility exceeds 1.9%, however, we are more likely to experience a losing month and a year.
In fact, Crestmont Research has only numerically proved what every experienced stock market trader knew. While the bull market is characterized by a slow rise in price, the bear market is known for sudden price drops. Thus, while the volatility indicator does not in itself indicate the price direction, for some instruments the increasing price spread signals bad news.
Example C
How can we trade volatility in the short term? There are many indicators that measure volatility, although they do not provide us with input/output signals on their own. The exception to this is the Bollinger Bands indicator.
The Bollinger indicates a certain band depicted on the chart (price spread based on average volatility). We can trade on bounces from this band’s limits to the moving average and speculate on a return to average volatility.
We can also wait for the extremely narrow band and trade the breakthrough to either side. This means placing sell-stop and buy-stop orders above and below the given price spread.
World volatility
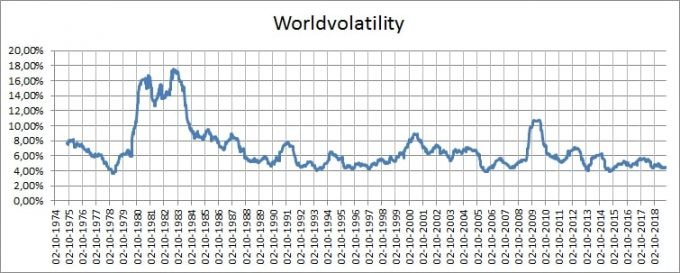
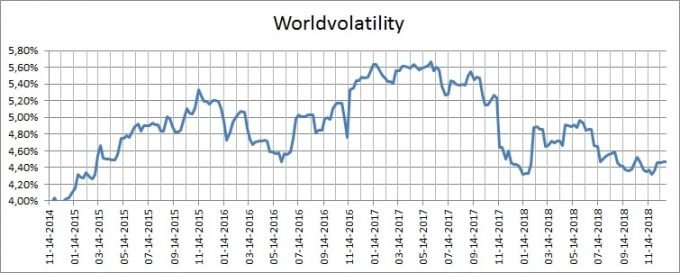
The worldvolatility.com website provides an interesting way to measure volatility in the financial markets from a global perspective. This figure is averaged by the volatility of gold, bonds, and Nasdaq stock index data. At the beginning of 2019, the global volatility was 4.47%.
In both the long and short term, this is a relatively low figure.

World volatility from 1975 to 2019

World volatility from 2014 to 2019
Do you want to try to trade volatile markets for yourself? Open an account with recommended brokers
| Broker | Bonus | Min Deposit | Minimum Trade Amount | Payout | Demo | US Traders Allowed | Review | Open Account |
|---|---|---|---|---|---|---|---|---|
 | FREE DEMO ACCOUNT | $ 10 | $ 1 | 82 % for Standard, 90 % for VIP accounts* | | Review | Trade Now! | |
 | FREE DEMO AND LOW MIN DEPOSIT | $ 10 | $ 1 | Up to 90 %!* | | Review | Trade Now! | |
 | Social trading features | $ 50 | $ 1 | Up to 95 %* | | Review | Trade Now! |


