

 I believe that this is not the first article you are reading on this subject. Anyway, before I start I should mention that false signals are part of trading, which you surely know. Sometimes you watch an important support or resistance zone and eventually you see a breakout. You react by taking a position but, all of a sudden, the market turns. So, you close your position and continue to wait. The market toys with you and sometimes pushes you out.
Note: This article is more detailed than usual and, compared to our standard articles, somewhat longer. However, I believe that it will be to your profit. So, let’s start on how to minimize losses caused by false breakouts.
When and why false breakouts occur
Usually, your chart identifies important support and resistance levels. These levels represent points where you should expect a reaction of some kind. If the level is very strong, one can expect that the market will bounce. However, what if it breaks? Is it a false signal or an opportunity for a great trade?
You can never be absolutely sure whether this is a serious (real) or false breakout. Anyway, if you have read about how big players can manipulate the market you know that one can never be sure. There is no certainty in the forex market or in markets in general. You already know that sometimes having a logical idea and odds on your side will do.
Support and Resistance
There are several important zones in each market, which you should mark graphically. Typically, these lines include trend lines, local support and resistance lines, pivot lines, or initial balance. Obviously, the chart also shows a double high/low and other important formations.
Draw all support and resistance lines in your chart, be it based on price action, Fibonacci sequence or any other indicator. Don’t forget that you want to see the lines on all time zones. For instance, from the yearly perspective it may seem that the market did not react on a support or resistance level but from the 15M or 5M prospectively you will nearly always see a reaction offering one or multiple profitable trades. Based on the above, it is necessary to see the lines on all time zones.
How to recognize false and real breakout
Instead of beating about the bush, let’s go ahead to breakouts. Support and resistance levels are already drawn in your chart, the price is approaching and a breakout follows. What to do now?
Tolerance Zones
Use Tolerance zone. Don’t trade a breakout by just one pip. Your support/resistance lines in your chart might not have been drawn exactly. Especially, when the trend line is long, a series of small deviations will result in a deviation that is much bigger. Anyway, even if your lines are drawn most accurately the line might be tested and a breakout of one pip can’t be regarded as a real breakout.
Your Tolerance zone depends on the timeframe you trade. With one-year support, it will surely be bigger than 30M. The instrument you are using is relevant too – the range might be roughly from 3 to 30 pips. By definition, a real breakout is when the market overcomes our drawn support/resistance lines including the Tolerance zone.
Some traders wait until the candlestick closes below support/above resistance line (i.e. the Tolerance zone determines the closing of the candlestick in a breakout). However, there are more options than that, for instance, trading of an already confirmed throwback (pullback).
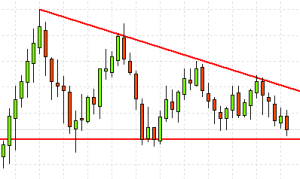
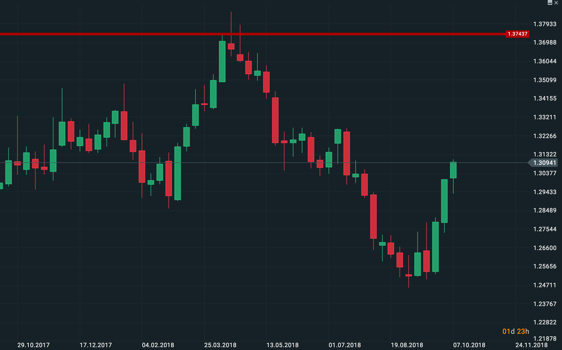
We have said that a Tolerance zone of a few ticks or another confirmation of a breakout is a fundament. This is demonstrated in the below picture. Significant minimum generated strong support. This line was later tested and, as shown in the chart, the support line was broken by a few ticks. As you can notice, in the end, this breakout turned out to be a false one and the market made a turn.
It would have been better not to trade this breakout. Always reserve a space for a “Tolerance zone”.
Even a strong support line might be conquered by a few points. This is clear proof that blind trading of support/resistance is not worth it. Any action requires some logic in the form of one more confirmation or at least a Tolerance zone. Also, ADX or declining trading volumes may protect you from a false breakout.
Small and big players
Big players face one problem: the amount of money they possess is too big. A market is a place where supply and demand come into game. If the big players want to buy more than the market is able to absorb they won’t find a counterparty. The reason is simple: excessive demand will push the price up to a point at which the big players will no longer want to trade.
Big players can see the same chart as you do know that stop losses or waiting orders tend to occur near important S/R lines. The number of the orders can’t be ignored and therefore, they decide to use them for making an order on their own. In a case like this, a false breakout may occur – in fact, initiated by the big players trying to receive profit from their stop losses and realize their enormous order volume.
A frequent problem the big players are faced with is capital volume. Look at the chart below to see how they manage such a situation. Moving sideways, they accumulate capital in small portions to create strong support which the later break, receive profit from the stop losses and invest the rest of the capital. This is an Exemplary move.
False breakout and sweeping of profit from stop losses. We recommend you read our article on the big players.
Price action
I admit that I personally prefer price action but I will show you indicators as well. To me, the first and absolutely crucial factors when watching the levels is tolerance. The situation now is much better than in the past. I remember times (5 – 7 years ago) when it was normal to see different prices offered by individual brokers and even different prices of platforms of two traders with the same broker. Even though the situation has improved significantly, you must allow for some tolerance, delay in calculation etc. I regard everything that happens within a 10-pip range from the drawn support/resistance line as a touch on the support/resistance level.
In other words, if I wanted to trade breakout I would take as breakout trades within the range of 10 pips. So, when trading breakout I don’t recognize a narrower range than 10 pips above a significant level. You may find this an obsolete practice (used when the data was not so accurate) but still in use because some small deviations may occur today, as well.
You should always confirm each breakout of a level. Prior to that, take it as if it was a false one. Typically, you wait until the candlestick gets closed halfway the breakout level. If the breakout leaves behind just a shadow (wick) it’s going to be a pin bar and one more strong price-action parameter. The pin bar will play in favor of a false breakout.
Taking a look at the chart may be enough to get a hint. Do you see a typical graphical formation? Or just a pin bar? If you do, be careful as long as the formation faces the breakout and the breakout is coming. I would consider reserving a larger tolerance zone or skipping this trading opportunity. On the contrary, if a price action confirms the breakout this is a good signal to trade.
It sounds too vague but it’s true: each trade is different. I personally found the aforementioned pin bars a very useful tool. If you don’t know what pin bar is read more here.
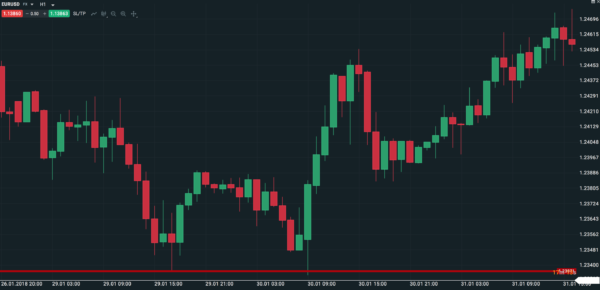
Typical false breakout with pin bar
In the above picture, you can see a typical false breakout with pin bar. An Exemplary example, indeed. If you wait until the candlestick gets closed above an important level you don’t enter the trade On the contrary, taking a short position following the pin bar was a tempting option.
As far as price action is concerned, it is worth repeating terms such as throwback and pullback. A pullback occurs when the price breaks below support, retraces back to support, which however now begins to act as resistance and rebounds from it, continuing its downward movement.
With this price action, watch the closing of the market and don’t trade the first incomplete breakout (it may later turn out to be a mere shadow), choose a tolerance zone and repeat the basic technical formations. I have one more rule to add: I trade the same level only once for a certain period of time. So, taking a long position based on a signal turning out to be a false one cannot happen to me. What I would do is close the position, open a new one – this time in the opposite direction – and, finally turn it back. A few false signals coming from the market may lure you into the above trap, which is why it is worth establishing a similar rule (I personally give myself one day for each important level. If the trading on the day is losing I no longer take the level into account).
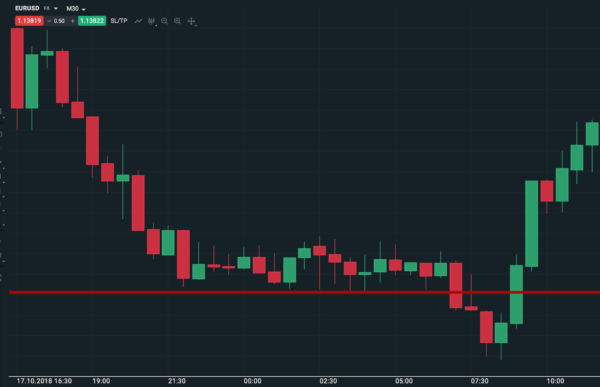
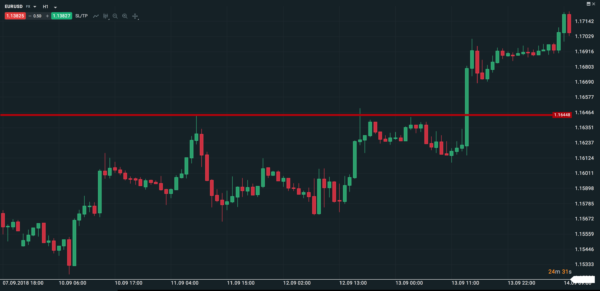
The example below shows a resistance level that was conquered by a few pips and then broken. Tolerance zone would filter off the first false breakout, so you could trade the second one, which is aggressive enough. The tolerance zone has been broken. Taking a position will pay off even if you wait for the closing of the candlestick above the resistance. The closing of candlestick above resistance (or below support) is often criticized since the market may move too much. On the other hand, it is wise to wait for a throwback and then take a position.
A large candlestick in the breakout direction often confirms its validity
Take a look at the below picture. Nothing may play in favor of the big players; you still can use the tolerance zone. Confirming breakout may occur on a lower timeframe, still generating a false breakout. This may happen too and it is part of trading. Your trading strategy surely anticipates some losing trades. Remember, these are things you can never avoid, however, you can minimize them. Same as a large candlestick confirms a breakout, a large candlestick in the opposite direction will confirm a rebound.
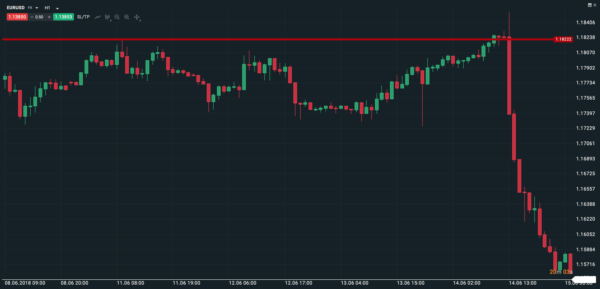
Rebound from resistance confirmed by a large candlestick pattern.
Trend or stagnation
If you correctly analyze the market you will find out that most of the time the market moves sideways i.e. stagnates. Even long-term trends may suffer trend moves followed by long sideway moves. What is the difference between trend and stagnation?
If you follow a trend it is important how strong the trend is. It’s wise to watch volume indicators and the speed of the moves. If the moves are aggressive it may signal an approaching breakout followed by the trend taking a second breath. If, however, it is a long-term slow trend you may expect at least some slowdown at an important level – so be vigilant with the breakout.
If the market stagnates, it’s likely that instead of a breakout it will rebound. The reality is harsh, the change in the direction of the trend is inevitable. Be careful and have the breakout confirmed!
How to recognize a false signal using indicators?
Filtering false breakout thanks to stochastic oscillator
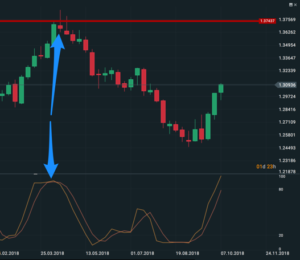
Paying attention to the stochastic oscillator, typically the 80-20 range, and the intersection that may indicate a trend reversal is a useful thing. Another good indicator (conditioned by your trust in the data from your broker) is volume. If the volume grows the breakout is going to be strong, the opposite attests to a false breakout. Frequently used are also ADX and RSI.
If you add stochastic oscillator (indicator) to the above chart you can see that it signals a trend reversal. So, according to the indicator, you should not trade the breakout.
I already mentioned the fact that when it comes to indicators I don’t like delay. You are constantly one candlestick behind and don’t fully see the presence. When used in a back-test, indicators do a great job but in real life, it’s worse. Saying this, I don’t want to put you off. On occasions, I use the indicators too. However, be careful. Let the candlestick slowly close and analyze all that has happened in the market. Don’t get distracted by the current candlestick. It may turn out to be a very good helper. It always begs the question if it’s not too late to use an indicator. I recommend that you combine both methods.
Using RSI and MACD indicators
False breakouts of forex and other markets can be filtered out by using the aforementioned methods. If you prefer trading with indicators it is worth watching MACD or RSI (to see potential trend reversal on MACD or overbought/oversold at 20 and 80 levels on RSI).
How to recognize real breakout
The screenshots can serve as the demonstration of a typical breakout. Notice that even waiting for closing the candlestick in the second half below, an important level, allows you to enter the trade (short position in our case) and to earn a decent profit. The first screenshot illustrates the market, the second one, more detailed, includes an indicator.
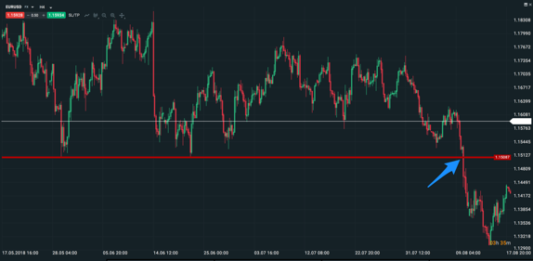
Exemplary breakout
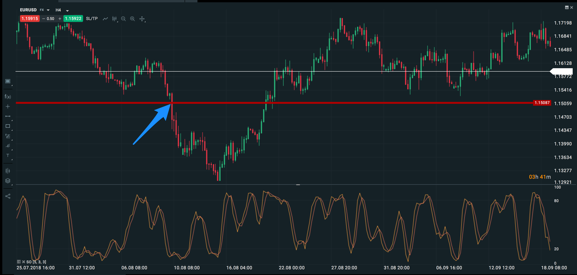
Exemplary breakout 2 (in detail)
More articles covering the subject
An opposite to recognising false signals is confirming rebounds. This topic is covered on our website by the following articles:.
- Part 8: Technical Analysis – Breakouts
- Part 11: Technical Analysis – Confirmation of rebound using indicators
- Part 12: Technical analysis – Confirming price action reversals
Author

More about the author J. Pro
Unlike Stephen (the other author) I have been thinking mainly about online business lately. I wasn't very successfull with dropshipping on Amazon and other ways of making money online, and I'd only earn a few hundreds of dollars in years. But then binary options caught my attention with it's simplicity. Now I'm glad it did because it really is worth it. More posts by this author
Hi J. Pro,
I am very thankful to you for sharing such a comprehensive technical analysis you have shared through this post. It even gets more easier for me to understand with the example and the case study you have shared!
I really appreciate your efforts
Thanks.
Hello, we really appreciate your feedback, thank you so much.
We hope that you will learn a lot of useful tips from our technical analysis show.
Have a nice day.